Using Microsoft Power BI with AllegroGraph

There are multiple methods to integrate AllegroGraph SPARQL results into Microsoft Power BI. In this document we describe two best practices to automate queries and refresh results if you have a production AllegroGraph database with new streaming data:

The first method uses Python scripts to feed Power BI. The second method issues SPARQL queries directly from Power BI using POST requests.

Method 1: Python Script:

Assuming you know Python and have it installed locally, this is definitely the easiest way to incorporate SPARQL results into Power BI. The basic idea of the method is as follows: First, the Python script enables a connection to your desired AllegroGraph repository. Then we utilize  AllegroGraph’s Python API within our script to run a SPARQL query and return it as a Pandas dataframe. When running this script within Power BI Desktop, the Python scripting service recognizes all unique dataframes created, and allows you to import the dataframe into Power BI as a table, which can then be used to create visualizations.

Requirements:

  1. You must have the AllegroGraph Python API installed. If you do not, installation instructions are here: https://franz.com/agraph/support/documentation/current/python/install.html
  2. Python scripting must be enabled in Power BI Desktop. Instructions to do so are here: https://docs.microsoft.com/en-us/power-bi/connect-data/desktop-python-scripts

a) As mentioned in the article, pandas and matplotlib must be installed. This can be done with ‘pip install pandas’ and ‘pip install matplotlib’ in your terminal.

The Process:

Once these requirements have been met, create a Python file with whatever script editor you usually use. The following code will create a connection to your desired repository. For this example, we will be using the Kennedy dataset that is available with the AllegroGraph distribution (See the ‘Tutorial’ directory).  Load the Kennedy.ntriples file into your running AllegroGraph. (Replace the ‘****’ in the code with your corresponding username and password.)

#the necessary imports

import os

from franz.openrdf.connect import ag_connect

from franz.openrdf.query.query import QueryLanguage

import pandas as pd


#connect to your agraph repository

def setup_env_var(var_name, value, description):

os.environ[var_name] = value

print("{}: {}".format(description, value))

setup_env_var('AGRAPH_HOST', 'localhost', 'Hostname')

setup_env_var('AGRAPH_PORT', '10035', 'Port')

setup_env_var('AGRAPH_USER', '****', 'Username')

setup_env_var('AGRAPH_PASSWORD', '****', 'Password')

conn = ag_connect('kennedy', create=False, clear=False)


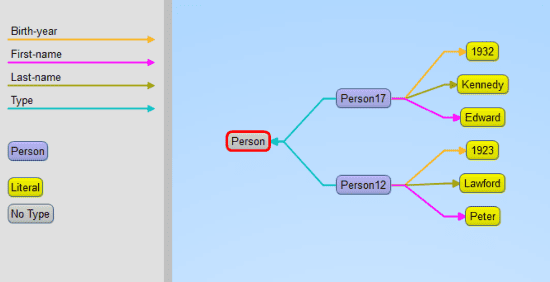
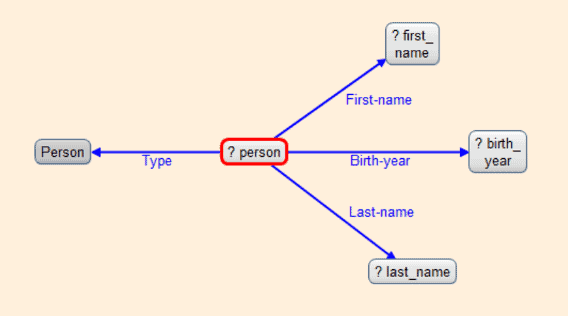
2. We then want to create a query. For this example, we will first show what our data looks like, what the visual query of the information is, and what the written query looks like. With the following query we want every person’s first and last names, as well as their birth years. Here is a small portion of the data visualized in Gruff, and then the visualization of the query:


3. Then add the written query to the python script as a variable string (we added an additional line to the query to sort on birth year). Next use the API functionality to simply execute the query and turn the results into a pandas dataframe.

query = """select ?person ?first_name ?last_name ?birth_year where
{ ?person <http://www.franz.com/simple#first-name> ?first_name ;
          <http://www.franz.com/simple#birth-year> ?birth_year ;
          rdf:type <http://www.franz.com/simple#person> ;
          <http://www.franz.com/simple#last-name> ?last_name . }
order by desc(?birth_year)"""

with conn.executeTupleQuery(query) as result:
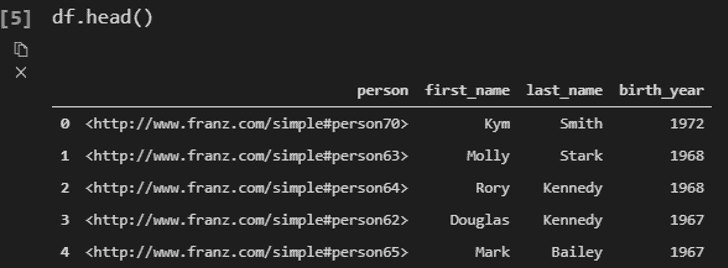
   df = result.toPandas()


When looking at the result, we see that we have a DataFrame!

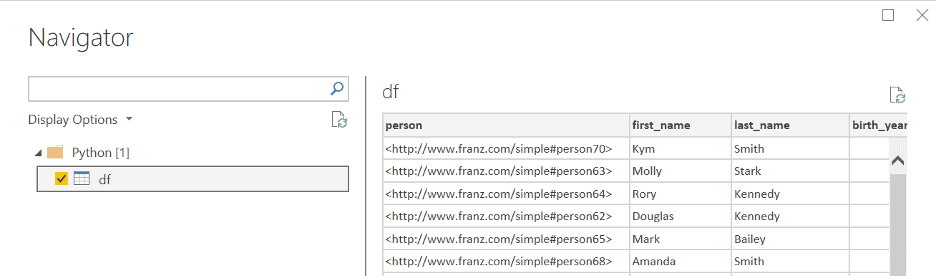
4.  Now we will use this script in Power BI. When in Power BI Desktop, go to ‘Get Data’ and look for the python script option. Then simply copy and paste your entire script into the text box, and run the script. In this case, our output looks like this:

5.  Next simply ‘Load’ the data, and then you can use the Power BI Desktop interface to create whatever visualizations you want! If you do have a lot of additional operations to perform on your dataframe, we recommend doing these in your python script.


Method 2: POST Request:

For the SPARQL query via POST requests to work you need to url-encode the query. Every modern programming language will support that, but in our example we will be using Python again. This method is better for when you do not have python locally installed or prefer a different programming language.

It is possible to send a GET request from Power BI, but once the results from the query reach a certain size, a POST request is required, which is confusing to do within the Power BI Desktop interface. The following steps will show you how to do SPARQL Queries using POST requests. It looks a bit odd but it works well.

The Process:

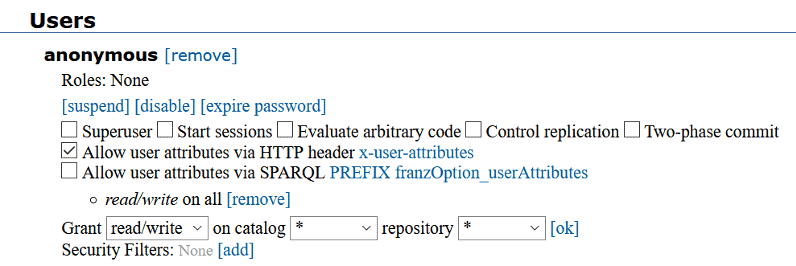
1.  In your AG WebView create an ‘anonymous’ user. (Go to admin -> Users -> [add a user] -> and add ‘anonymous’ as username without adding a password). You can use these settings:

2.  Go to your desired repository in WebView and Click on ‘Queries’ -> ‘New’

3.  Write a simple SPARQL query, and run it to make sure you get the correct response back.

4.  In python create the following script: (Assuming your AllegroGraph is on your localhost port 10035 and your repo is called ‘kennedy’)


import urllib

def CreatePOSTquery(query):
    start = "http://anonymous:@localhost:10035/repositories/kennedy?queryLn=SPARQL&limit=1000&infer=false&returnQueryMetadata=false&checkVariables=false&query="
    response = start + urllib.parse.quote(query)
    return response


This function url-encodes the query and attaches it to the POST request. Replace the ‘localhost:10035’ and ‘kennedy’ strings in the start variable with your corresponding data. Then, using the same query as our previous example, we create our url-encoded POST query:


query = """select ?person ?first_name ?last_name ?birth_year where
{ ?person <http://www.franz.com/simple#first-name> ?first_name ;
          <http://www.franz.com/simple#birth-year> ?birth_year ;
          rdf:type <http://www.franz.com/simple#person> ;
          <http://www.franz.com/simple#last-name> ?last_name . }
order by desc(?birth_year)"""

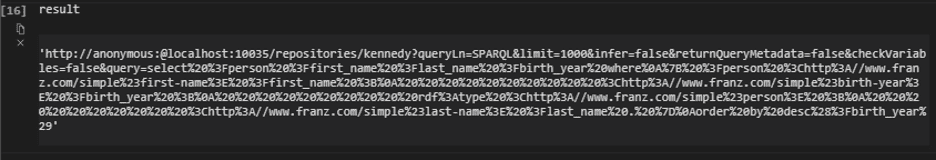
result = CreatePOSTquery(query)
print(result)


This gives us the following result:


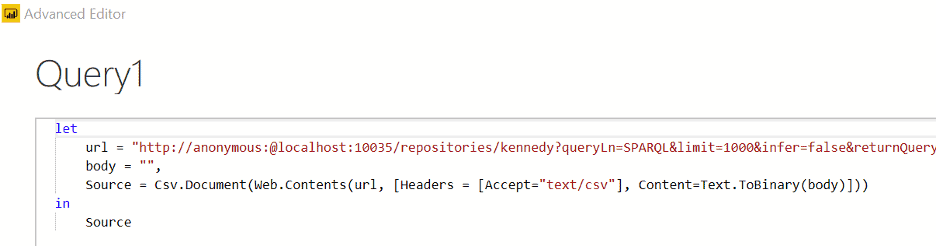
5.  Within Power BI Desktop we go to ‘Get data’ and create a ‘Blank query’ and go into the ‘Advanced Editor’ window. Using the following format we will get our desired results (please note that due to the length of the url-encoded request, it did not all fit in the image. Copy and pasting into the url field works fine. The ‘url’ variable needs to be in quotes and have a comma at the end):


We see the following results:

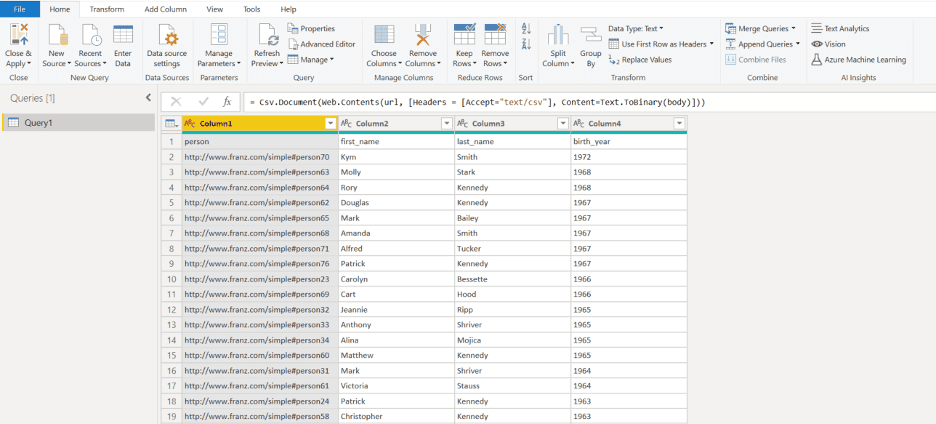
6.  One last step is to turn the top row into the column names, which can be achieved by pressing the ‘Use first row as headers’:

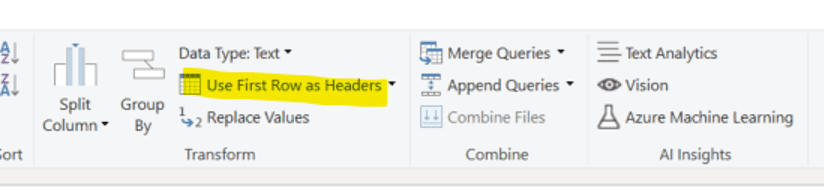
The best part about both of these methods is that once the query has been created, Power BI can refresh the visuals using the same queries if your data changed. This can be achieved by scheduling refreshes within the Power BI Desktop interface (https://docs.microsoft.com/en-us/power-bi/connect-data/refresh-data#configure-scheduled-refresh)

Please send any questions or issues to:  [email protected]


Knowledge Graphs rise in Gartner’s Hype Cycle

“The 2019 Hype Cycle highlights the emerging technologies with significant impact on business, society and people over the next five to 10 years,” says Brian Burke, Research Vice President, Gartner. “Technology innovation is the key to competitive differentiation and is transforming many industries.”

This year’s emerging technologies fall into five major trends: Sensing and mobility, augmented human, postclassical compute and comms, digital ecosystems, and advanced AI and analytics.

Read the full Gartner press release.


Gruff Time Machine Tutorial

Here is an example for trying out the new time slider in Gruff’s graph view. It uses triples from crunchbase.com that contain a history of corporate acquisitions and funding events over several years. Gruff’s time bar allows you to examine those events chronologically, and also to display only the nodes that have events within a specified date range.


  • Create a new triple-store and used “File | Load Triples | Load
    N-Triples” to load that triples file into the new triple-store. Use
    “File | Commit” to ensure that the loaded triples get saved.


  • Select “Visual Graph Options | Time Bar | Momentary Time Predicates”
    and paste the following five predicate IRIs into the dialog that
    appears. The time bar will then work with the date properties that
    are provided by these predicates, whenever you are browsing this
    particular triple-store.

http://www.franz.com/hasfunded_at
http://www.franz.com/hasfirst_funding_at
http://www.franz.com/hasfounded_at
http://www.franz.com/haslast_funding_at
http://www.franz.com/hasacquired_at

  • Select “View | Optional Graph View Panes | Show Time Bar” to reveal
    the time bar at the bottom of the graph view. The keyboard shortcut
    for this command is Shift+A to allow quickly toggling the time bar
    on and off.


  • Select “Display | Display Some Sample Triples” to do just that. The
    time bar will now display a vertical line for each of the requested
    date properties of the displayed nodes. Moving the mouse cursor
    over these “date property markers” will display more information
    about those events.


  • Click down on the yellow-orange rectangle at the right end of the
    time bar and drag it to the left. This will make the “time filter
    range” smaller, and nodes that have date properties that are no
    longer in this range will temporarily disappear from the display.
    They will reappear if you drag the slider back to the right or
    toggle the time bar back off.

For more information, the full time bar introduction is in the Gruff documentation under the command “View | Optional Graph View Panes | Show Time Bar”.

Check out the “Chart Widget” for showing date properties of the visible nodes.


New Gruff v7.4 – Now Available!

DOWNLOAD – Gruff

Gruff is the Knowledge Graph industry’s leading Graph Visualization software for exploring and discovering connections within data. Gruff provides novice users and graph experts the ability to visually build queries and explore connections as they developed over time.

Gruff produces dynamic data visualizations that organize connections between data in views that are driven by the user. This visual flexibility can instantly unveil new discoveries and knowledge that turn complex data into actionable business insights. Gruff was developed by Franz to address Graph Search in large data sets and empower users to intelligently explore graphs in multiple views including:

  • Graphical View with “Time Machine” feature – See the shape and density of graph data evolve over time
  • Tabular view – Understand objects as a whole
  • Outline view – Explore the often hierarchical nature of graphs
  • Query view – Write Prolog or SPARQL queries
  • Graphical Query Builder – Create queries visually via drag and drop

Gruff’s  ‘Time Machine’ feature provides users an important capability to explore temporal connections in your data.  Users can see how relationships are created over time and are able to replay the evolving graph for new temporal based insights.


Key New Features and Updates in Gruff v7.4 – To see the full list – Release Notes.

  • The new command “File | Connect to Gruff Demo Server” lets you try out Gruff on the “extended actors” database at a public AllegroGraph server that’s provided by Franz, when you don’t have an AllegroGraph server yourself. See the Example button in the query view and in the graphical query view for a few example queries. “Help | Animated Demo” also works there.
  • The graphical query view has new grouper boxes for graph group graph pattens, either for a particular graph or for a graph variable.
  • The graphical query view now has node filters for the SPARQL operators IN and NOT IN (for limiting a node variable to a particular set of values), for langMatches (for selecting only literals of a particular language), and for CONTAINS, STRSTARTS, and STRENDS (for finding literals that contain specified text). Also, the “bound” and “not bound” filters were broken, and the LIMIT and OFFSET values will now be included when saving a graphical query.
  • Gruff can now connect to AllegroGraph servers through an HTTP proxy (as was possible with SPARQL endpoints already). See Global Options | Communications | HTTP Proxy.
  • Additional triple file formats can now be loaded with the new commands “File | Load Triples | Load JSON-LD”, “Load TriG”, and “Load N-Quads Extended”. Corresponding new commands are also on the “File | Export Displayed Data As” child menu. Also, the new command “Global Options | Miscellaneous | Commit Frequency When Loading Triples” lets you control whether and how often commits will happen during loading.
  • The query view’s “Create Visual Graph” button will now create link lines for additional SPARQL property path operators, namely InversePath ( ^ ) and AlternativePath ( | ). And it will draw the correct character for ZeroOrOnePath ( ? ). (See “Query Options | Show Links for Property Paths in Visual Graphs” for turning this off.)
  • If the triple store defines label properties for predicates, then Gruff will now display those labels for the predicate objects as it has always done for nodes, as long as “Global Options | Node Label Predicates | Use Label Predicates for Node Labels” is on.
  • When “Visual Graph Options | Node Labels | Show Full URIs on Nodes” is on, full URIs will be also displayed for the predicates in link labels. And full URIs will be shown in the legend as well.

Gruff Documentation


Gartner Identifies Top 10 Data and Analytics Technology Trends for 2019

According to Donald Feinberg, vice president and distinguished analyst at Gartner, the very challenge created by digital disruption — too much data — has also created an unprecedented opportunity. The vast amount of data, together with increasingly powerful processing capabilities enabled by the cloud, means it is now possible to train and execute algorithms at the large scale necessary to finally realize the full potential of AI.

“The size, complexity, distributed nature of data, speed of action and the continuous intelligence required by digital business means that rigid and centralized architectures and tools break down,” Mr. Feinberg said. “The continued survival of any business will depend upon an agile, data-centric architecture that responds to the constant rate of change.”

Gartner recommends that data and analytics leaders talk with senior business leaders about their critical business priorities and explore how the following top trends can enable them.


Trend No. 5: Graph

Graph analytics is a set of analytic techniques that allows for the exploration of relationships between entities of interest such as organizations, people and transactions.

The application of graph processing and graph DBMSs will grow at 100 percent annually through 2022 to continuously accelerate data preparation and enable more complex and adaptive data science.

Graph data stores can efficiently model, explore and query data with complex interrelationships across data silos, but the need for specialized skills has limited their adoption to date, according to Gartner.

Graph analytics will grow in the next few years due to the need to ask complex questions across complex data, which is not always practical or even possible at scale using SQL queries.

https://www.gartner.com/en/newsroom/press-releases/2019-02-18-gartner-identifies-top-10-data-and-analytics-technolo


Franz and Semantic Web Co. Partner to Create a Noam Chomsky Knowledge Graph

Press Release – September 10, 2018

First Semantic Knowledge Graph for a Public Figure will Semantically Link Books, Interviews, Movies, TV Programs and Writings from the Most Cited U.S. Scholar

OAKLAND, Calif. and VIENNA, Austria — Franz Inc., an early innovator in Artificial Intelligence (AI) and leading supplier of Semantic Graph Database technology, AllegroGraph, for Knowledge Graphs, and Semantic Web Company, developers of the PoolParty Semantic Suite and leading provider of Semantic AI solutions, today announced a partnership to develop the Noam Chomsky Knowledge Graph. This project is the first aimed at connecting all the works from a public figure and turning the linked information into a searchable and retrievable resource for the public.

The Noam Chomsky Knowledge Graph project will organize and semantically link the vast knowledge domain surrounding Noam Chomsky, the founder of modern linguistics, a founder of cognitive science, and a major figure in analytic philosophy as well as an American linguist, philosopher, historian and social critic. Chomsky is currently an Institute Professor Emeritus at the Massachusetts Institute of Technology (MIT) and laureate professor at the University of Arizona. He has received many awards including Distinguished Scientific Contribution Award of the American Psychological Association, the Kyoto Prize in Basic Sciences, the Helmholtz Medal, the Dorothy Eldridge Peacemaker Award, and the Ben Franklin Medal in Computer and Cognitive Science.

“Noam Chomsky is one of the most brilliant minds of our generation,” said Fred Davis. Executive Director of the Chomsky Knowledge Graph project, “His body of work is tremendously valuable to people across many disciplines. Our goal is to make Chomsky’s work searchable in the context of topics and concepts, readable in excerpts, and easily available to journalists, scientists, technologists, students, philosophers, and historians as well as the general public.”

The Noam Chomsky Knowledge Graph will link to over 1,000 articles and over 100 books that Chomsky has authored about linguistics, mass media, politics and war. Hundreds of Chomsky’s media interviews, which aired on television, print and online will be part of the Knowledge Graph as well as more than a dozen Chomsky movies including:  Is the Man who is Tall Happy?, Manufacturing Consent, Programming the Nation? Hijacking Catastrophe:  911 Fear and the Selling of American Empire. The content will be made available by searching the Knowledge Graph for specific titles, related topics and concepts.

Since the project is based on the latest and most advanced technologies, the data will be also available as machine-readable data (Linked Data) in order to be fed into smart applications, intelligent chatbots, and question/ answering machines – as well as other AI and data systems.

The Internet Archive, the world’s largest digital lending library, will host Noam Chomsky’s books, movies, and other content – enabling public access to his works and marking the first integration between the Internet Archive and a public Knowledge Graph.

“We are thrilled to be working on this momentous project,” said Dr. Jans Aasman, CEO of Franz Inc. “Noam Chomsky is the ideal person to fulfill the vision of a Public Figure Knowledge Graph. We are looking forward to collaborating with the Semantic Web Company and Fred Davis on this exciting project.”

“Knowledge Graphs are becoming increasingly important for addressing various data management challenges in industries such as financial services, life sciences, healthcare or energy,” said Andreas Blumauer, CEO and founder of Semantic Web Company. “The application of Knowledge Graphs to public figures, such as Noam Chomsky, will offer a unique opportunity to link concepts and ideas to form new ideas and possible solutions.”

About Knowledge Graphs

A Knowledge Graph represents a knowledge domain and connects things of different types in a systematic way. Knowledge Graphs encode knowledge arranged in a network of nodes and links rather than tables of rows and columns. People and machines can benefit from Knowledge Graphs by dynamically growing a semantic network of facts about things and use it for data integration, knowledge discovery, and in-depth analyses.

Gartner recently identified Knowledge Graphs as a key new technology in both their Hype Cycle for Artificial Intelligence and Hype Cycle for Emerging Technologies. Gartner’s Hype Cycle for Artificial Intelligence, 2018 states, “The rising role of content and context for delivering insights with AI technologies, as well as recent knowledge graph offerings for AI applications have pulled knowledge graphs to the surface.”

Knowledge Graphs are the Foundation for Artificial Intelligence

The foundation for AI lies in the facets Knowledge Graphs and semantic technology provided by Franz and Semantic Web Company. The Franz AllegroGraph Semantic Graph database provides the core technology environment to enrich and contextualized the understanding of data. The ability to rapidly integrate new knowledge is the crux of the Knowledge Graph and depends entirely on semantic technologies.

About Franz Inc.

Franz Inc. is an early innovator in Artificial Intelligence (AI) and leading supplier of Semantic Graph Database technology with expert knowledge in developing and deploying Knowledge Graph solutions. The foundation for Knowledge Graphs and AI lies in the facets of semantic technology provided by AllegroGraph and Allegro CL.  The ability to rapidly integrate new knowledge is the crux of the Knowledge Graph and Franz Inc. provides the key technologies and services to address your complex challenges.  Franz Inc. is your Knowledge Graph technology partner. For more information, visit www.franz.com.

About Semantic Web Company

Semantic Web Company is the leading provider of graph-based metadata, search and analytic solutions. The company is the vendor of PoolParty Semantic Suite, one of the most renowned semantic software platforms on the global market. Among many other customers, The World Bank, AT&T, Deutsche Telekom, and Pearson benefit from linking structured and unstructured data. In 2018, the Semantic Web Company has been named to KMWorld’s “100 companies that matter in Knowledge Management.” For more information about PoolParty Semantic Suite, please visit https://ww.poolparty.biz


All trademarks and registered trademarks in this document are the properties of their respective owners.


Gartner – Knowledge Graphs Emerge in the HypeCycle

From Gartner – August 2018

Gartner Identifies Five Emerging Technology Trends That Will Blur the Lines Between Human and Machine

Gartner’s HypeCycle report is know acknowledging Knowledge Graphs, a market area that Franz has been leading with AllegroGraph.

Read Jans Aasman’s IEEE paper on the Enterprise Knowledge Graph for more insight.


From the Gartner Press release:

Digitalized Ecosystems

Emerging technologies require revolutionizing the enabling foundations that provide the volume of data needed, advanced compute power and ubiquity-enabling ecosystems. The shift from compartmentalized technical infrastructure to ecosystem-enabling platforms is laying the foundations for entirely new business models that are forming the bridge between humans and technology.

This trend is enabled by the following technologies: Blockchain, Blockchain for Data Security, Digital Twin, IoT Platform and Knowledge Graphs.

“Digitalized ecosystem technologies are making their way to the Hype Cycle fast,” said Walker. “Blockchain and IoT platforms have crossed the peak by now, and we believe that they will reach maturity in the next five to 10 years, with digital twins and knowledge graphs on their heels.”

Read the full article over at Gartner.


Allegro Knowledge Graph News

Franz periodically distributes newsletters to its Semantic Technologies, and Common Lisp based Enterprise Development Tools mailing lists, providing information on related upcoming events and new software product developments.

Read our latest AllegroGraph newsletter.

Previous issues are listed in the Newsletter Archive.


Semantic Graph Analytics Can Propel The Advent of ‘Personalized Medicine’

From Health IT Outcomes:

Analyzing massive stores of medical data can be overwhelming. Still, it’s an important mission: data analysis could provide new, more tailored treatments. Terms like “personalized medicine,” “precision medicine,” and “individualized medicine” all refer to a data-driven approach toward to goal of customizing medical treatment for every patient’s unique genetic and molecular composition. However noble, that goal is somewhat limited.

Personalized medicine, often described as a way to provide “the right patient with the right drug at the right dose at the right time,” in fact goes beyond custom treatment – it encompasses the entire healthcare process, from prevention, to treatment, to disease management, and considers each patient as an individual.

Read the full article:


AllegroGraph Recognized as Best in Semantic Web Technology – USA & Leader in Graph Database Products

Franz’s AllegroGraph Fueling Rapid Growth in Graph Database Category

OAKLAND, Calif. — February 3, 2016 — Franz Inc., an early innovator in Artificial Intelligence (AI) and leading supplier of Semantic Graph Database technology has been recognized As “Best in Semantic Web Technology – USA & Leader in Graph Database Products” by Corporate America Software and Technology.

“At Corporate America, it’s our priority to showcase prominent professionals who are excelling in their industry and outperforming their competitors,” said Hannah Stevenson, Managing Group Editor, AI Global Media. “Franz Inc. have a reputation for innovation, utilizing their expert knowledge to create complex and exciting Graph Database solutions. Franz’s unique platforms offer highly scalable technologies for solving complex Big Data challenges.”

Corporate America is the definitive magazine for CEOs, top tier management and key decision makers across the US. Created to inform, influence, and shape the corporate conversation across the nation through high quality editorial, in-depth research and an experienced and dedicated network of advisers, Corporate America provides its readership with the most authoritative and current analysis of the major changes effecting the corporate landscape, and the latest deals and topical issues dominating the corporate universe. A multifaceted program, the awards are focused on rewarding excellence across all areas of the technology and software industries and all nominees are closely scrutinized to ensure that only the most deserving receive Corporate America’s prestigious awards.

“We are excited that Graph Databases, like AllegroGraph, have garnered the attention they deserve by Enterprise customers looking to innovate,” said Dr. Jans Aasman, CEO, Franz Inc. “In today’s data-driven environments, the ability to quickly analyze data from diverse sources is becoming critical. We are already seeing how Semantic Graph Databases with predictive analytics can help transform healthcare through Precision Medicine and make us safer through Insider Threat Detection.”

“Because it (AllegroGraph) is a Graph database, it can store pretty much any kind of data and query it, not just in the time-worn relational fashion, but also in a graphical manner – carving out graphical maps of relationships. And on top of that, it can apply semantics to deduce as-yet-undiscovered knowledge from the data. Its capabilities are very broad, and they provide a glimpse of the shape of things to come,” added Bloor. stated Robin Bloor, co-founder and Chief Analyst of The Bloor Group.

“Information has always existed everywhere but has often been isolated, incomplete, unavailable or unintelligible,” according to Gartner. “Advances in semantic tools such as graph databases as well as other emerging data classification and information analysis techniques will bring meaning to the often chaotic deluge of information.” (Source: Gartner Identifies the Top Strategic Technology Trends for 2016.)

A recent Forrester Research report stated, “Graph databases are a powerful optimized technology that link billions of pieces of connected data to help create new sources of value for customers and increase operational agility for customer service. Because graph databases track connections among entities and offer links to get more detailed information, they are well-suited for scenarios in which relationships are important, such as cybersecurity, social network analysis, eCommerce recommendations, dependence analysis, and predictive analytics.” (Source: Forrester Research, Market Overview: Graph Databases, May 28, 2015)

Franz’s recent announcement of the first Semantic Data Lake (SDL) for Healthcare, which was created in collaboration with Montefiore Medical Center (the eighth largest hospital group in the U.S.), Intel, Cloudera and Cisco. The SDL for Healthcare is a scalable and extensible Healthcare platform designed for Accountable Care and Personalized Medicine initiatives. AllegroGraph has played a critical role in the Semantic Data Lake for Healthcare, by facilitating integration of complex information for basic science, clinical, population, community, environmental, behavioral and wellness research data to enable knowledge-based analytics, classification, pattern recognition, predictive modeling and simulations at scale.

About Corporate America

Corporate America is more than just a magazine. Alongside our quarterly publication, we also produce a website that is regularly updated with the latest news, features, opinion and comment, again in conjunction with a host of top-level advisers, experts and businesspeople, and throughout the year, you’ll also get your chance to participate in our highly regarded awards programs, designed to pay tribute to the finest firms and individuals on the American business landscape.

About AllegroGraph

Unlike traditional relational databases or Property Graph Databases, AllegroGraph employs semantic graph technologies that process data with contextual and conceptual intelligence. AllegroGraph is able run queries of unprecedented complexity to support predictive analytics that help organizations make more informed, real-time decisions. AllegroGraph is the first Graph Database to support analysis across N-dimensions – any conceivable measurement of an object, property or operation. AllegroGraph can analyze temporal (time) and geospatial (location) dimensions relative to any ‘event,’ such as a disease, drug interaction, genetic combination, biomarkers, observations, image or physical sensors. AllegroGraph is utilized by dozens of the top Fortune 500 companies worldwide.

About Franz Inc.

Franz Inc. is an early innovator in Artificial Intelligence (AI) and leading supplier of Semantic Graph Database technology with expert knowledge in developing and deploying complex Big Data analytics solutions. AllegroGraph, Franz’s flagship, high-performance, transactional, and scalable Semantic Graph Database, provides the solid storage layer for Enterprise grade NoSQL solutions. AllegroGraph’s Activity Recognition capabilities provides a powerful means to aggregate and analyze data about individual and organizational behaviors, preferences, relationships, plus spatial and temporal linkages between individuals and groups. For additional Franz Inc customer success stories please visit:

  • AllegroGraph – http://franz.com/agraph/success/
  • Allegro CL – http://franz.com/success/

Franz’s Professional Service team is in the business of helping companies turn Data into Information and Information into Knowledge. We combine Data, Business Intelligence, and Analytics consulting services under one roof for our customers. Franz, an American owned company based in Oakland, California, is committed to market-driven product development, the highest levels of product quality and responsive customer support and service. Franz customers include dozens of Fortune 500 companies and span the healthcare, government, life sciences and telecommunications industries worldwide. Franz has demonstrated consistent growth and profitability since inception.

All trademarks and registered trademarks in this document are the properties of their respective owners.