High Performance Data Visualizations Accelerate Graph Search and Query Building — Driving Data Discoveries for Banks, Healthcare Providers and Enterprises Globally
OAKLAND, Calif., May 12, 2020 — Franz Inc., an early innovator in Artificial Intelligence (AI) and leading supplier of Semantic Graph Database technology for Knowledge Graph Solutions, today announced Gruff 8, a browser-based graph visualization software tool for exploring and discovering connections within enterprise Knowledge Graphs. Gruff 8, which has been integrated into AllegroGraph 7, enables users to visually build queries and visualize connections between data without writing code, which speeds discoveries and enhances the ability to uncover hidden connections within data.
“By augmenting Knowledge Graphs with visualizations, users can determine insights that would otherwise elude them,” said Jans Aasman, CEO of Franz Inc. “Gruff’s dynamic data visualizations increase users’ understanding of data by instantly illustrating relevant relationships, hidden patterns and data’s significance to outcomes. Gruff also helps make data actionable by displaying it in a way that decision-makers can see the significance of data relative to a business problem or solution.”
“Few tools exist that can quickly turn arbitrary RDF graph pattern matches into clear visualizable results,” said Michael Pool, Global Head of Semantic Modeling and Engineering, Senior Director at BNY Mellon Bank. “Gruff is invaluable in turning our knowledge graph data into useful and actionable analytic insights.”
Gruff enables users to create visual Knowledge Graphs that display data relationships in views that are driven by the user. Ad hoc and exploratory analysis can be performed by simply clicking on different graph nodes to answer questions. Gruff’s unique ‘Time Machine’ feature provides the capability to explore temporal context and connections within data. The visual query builder within Gruff empowers both novice and expert users to create simple to highly complex queries without writing any code.
Browser-based Graph Visualization – Gruff 8 is a browser-based application that does not require an additional download or application installation once AllegroGraph is installed. All AllegroGraph users need is a web browser and internet connection to login. This approach gives users the convenience to access Gruff from anywhere on any type of system, while also simplifying deployment and streamlining updates within enterprise environments.
Louis Rumanes at UnitedHealth Group Research and Development recognizes the value of using Gruff as a browser-based app and commented, “Nice job on Gruff in a browser and I think this will be a gamechanger.”
Accelerated Visual Graph Rendering – Visual renderings within Gruff are now up to 3X faster. Users can dynamically lay out cyclical graphs, display tables of properties and build SPARQL or Prolog queries as visual diagrams.
Dynamic Graph Visualizations within AllegroGraph – Gruff is fully integrated with AllegroGraph 7, Franz’s leading semantic knowledge graph solution, which seamlessly leverages Gruff’s advanced graph visualizations and graphical query builder to reveal hidden connections in knowledge graph data. AllegroGraph 7, with FedShard™, is a breakthrough Knowledge Graph solution that allows infinite data integration through a patented approach that unifies all data and knowledge base silos into an Entity-Event Knowledge Graph solution that can support massive big data analytics. AllegroGraph 7 utilizes unique federated sharding capabilities that drive 360-degree insights and enable complex reasoning across distributed Knowledge Graphs.
To support ubiquitous AI, a Knowledge Graph system needs to fuse and integrate data, not just in representation, but in context (ontologies, metadata, domain knowledge, terminology systems), and time (temporal relationships between components of data). The rich functional and contextual integration of multi-modal, predictive modeling, artificial intelligence suitable for large scale analytics is what distinguishes AllegroGraph 7 as a modern, scalable enterprise analytic platform.
AllegroGraph 7 is the first big temporal Knowledge Graph technology that encapsulates a novel entity-event model natively integrated with domain ontologies and metadata with dynamic ways of setting the analytics lens on all entities in the system (patient, person, devices, transactions, events, and operations) as prime objects that can be the focus of an analytic (AI, ML, DL) process.
“AllegroGraph 7’s support of Entity-Event Data Modeling is the most welcome innovation and addition to our arsenal in reimagining healthcare and implementing Precision Medicine,” said Dr. Parsa Mirhaji, Director of Center for Health Data Innovations at the Albert Einstein College of Medicine and Montefiore Health System, NY. “Precision Medicine is about moving away from statistical averages and broad-based patterns. It is about connecting many dots, from different contexts and throughout time, to support precision diagnosis and to recommend the precision care that can take into account all the subtle differences and nuisances of individuals and their personal experiences throughout their life. This technology is about saving lives, by leveraging data, context and analytics and is what Franz’s Entity-Event Data Modeling brings to the table.”
Gruff 8 Availability and Pricing
Guff 8 is immediately available as a free download from AllegroGraph.com and is integrated as part of AllegroGraph’s cloud offering on the Amazon Marketplace.
Gruff Webinar
Join Franz’s webcast discussing Gruff 8 entitled “Visualizing and Exploring Knowledge Graphs with the New Browser based Gruff” – by registering for the May 14th Webinar.
About Franz Inc.
Franz Inc. is an early innovator in Artificial Intelligence (AI) and leading supplier of Semantic Graph Database technology with expert knowledge in developing and deploying Knowledge Graph solutions. The foundation for Knowledge Graphs and AI lies in the facets of semantic technology provided by AllegroGraph and Allegro CL. AllegroGraph is a database technology that enables businesses to extract sophisticated decision insights and predictive analytics from highly complex, distributed data that cannot be uncovered with conventional databases. Unlike traditional relational databases or other NoSQL databases, AllegroGraph employs semantic graph technologies that process data with contextual and conceptual intelligence. AllegroGraph is able run queries of unprecedented complexity to support predictive analytics that help organizations make more informed, real-time decisions. AllegroGraph is utilized by dozens of the top F500 companies worldwide. To learn more about Franz and AllegroGraph, go to www.franz.com.
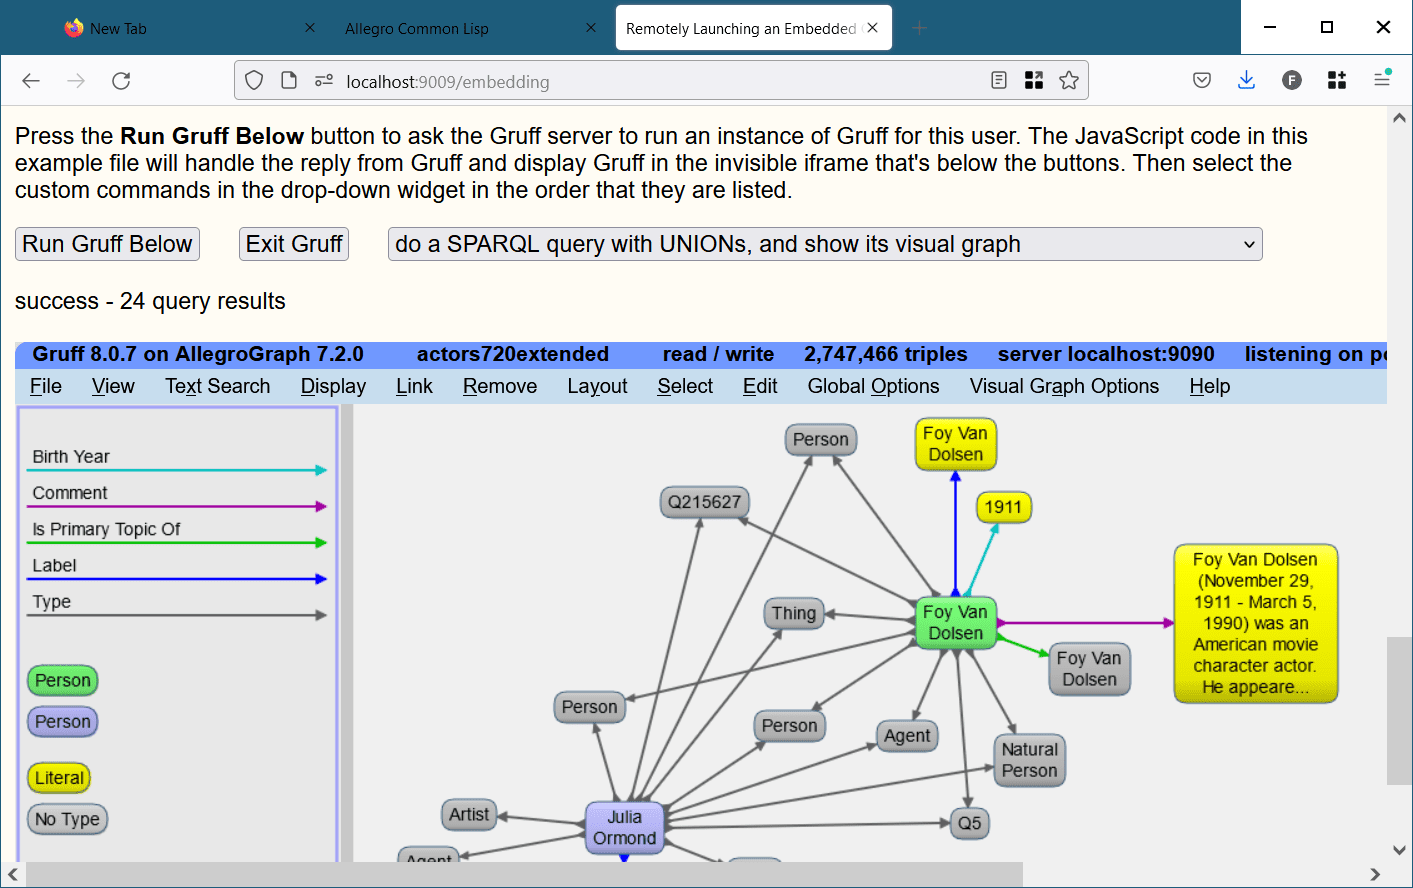 A Gruff feature allows a single launcher instance of Gruff to be running as a server and listening for requests from web browsers. It will launch a separate instance of Gruff for each web page that requests one, up to a specified limit. It can optionally use the launcher instance itself for one client, to minimize the number of Gruff executables that are running. Running Gruff as a server uses various command line options that are described under Running Gruff in a Web Browser.
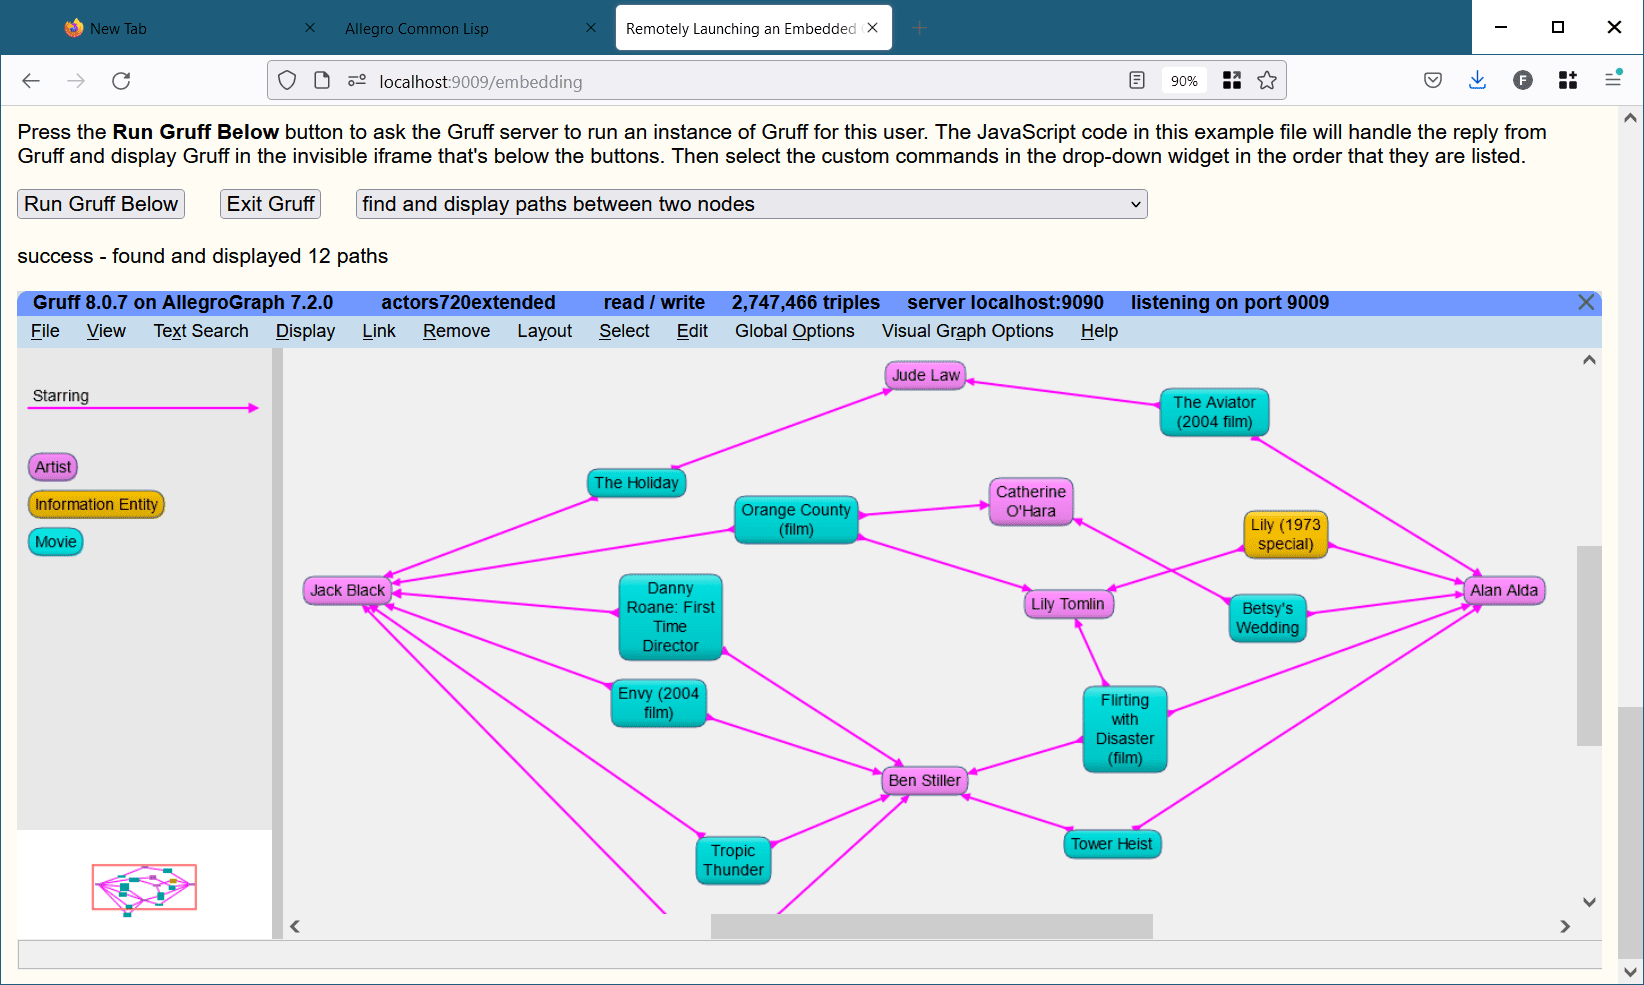 Simply embedding Gruff in an HTML iframe allows a reader to use Gruff by itself as usual inside your web page. A more advanced feature is that your web application can also send custom commands to Gruff. For example, your application could derive a set of triples that it wants Gruff to display, and then send those triples to Gruff. The code in embedding.html also demonstrates this ability. The complete documentation for sending commands to Gruff is at The HTTP Interface to Gruff.