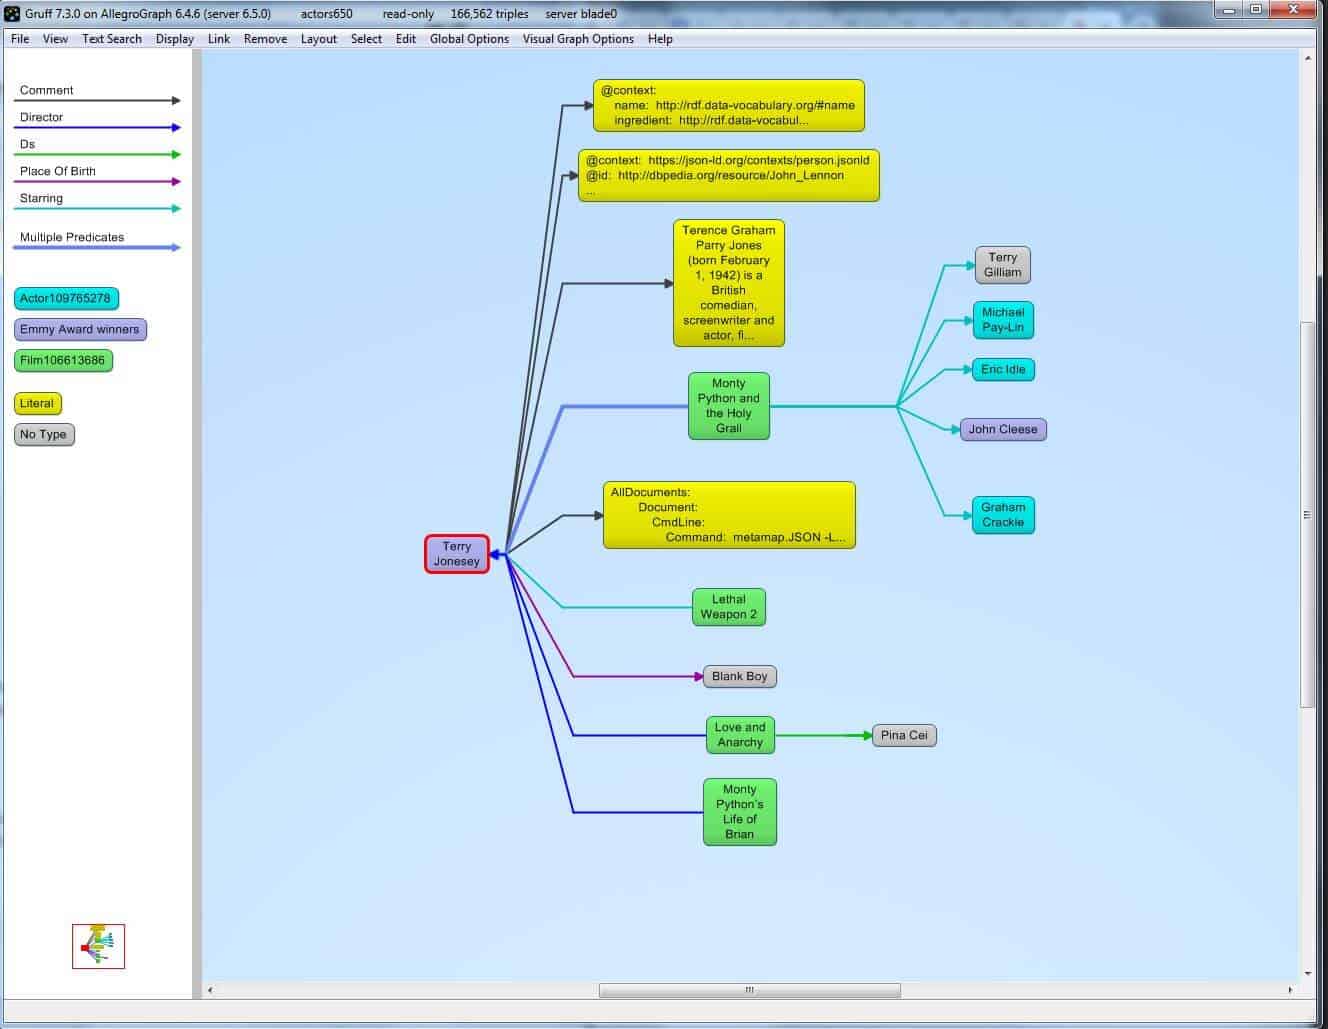
Webinar – Visualizing and Exploring Knowledge Graphs with the New Browser based Gruff
By augmenting knowledge graphs with visualizations, users can determine insights that would otherwise elude them. Gruff’s dynamic data visualizations increase users’ understanding of data by instantly illustrating relevant relationships, hidden patterns and data’s significance to outcomes. Gruff also helps make data actionable by displaying it in a way that decision-makers can see the significance of data relative to a business problem or solution.
 Gruff enables users to create visual knowledge graphs that display data relationships in views that are driven by the user. Ad hoc and exploratory analysis can be performed by simply clicking on different graph nodes to answer questions. Gruff’s unique ‘Time Machine’ feature provides the capability to explore temporal context and connections within data. The visual query builder within Gruff empowers both novice and expert users to create simple to highly complex queries without writing any code.
Join us for this webinar to learn how Healthcare organizations and Banks are exploring their Knowledge Graphs
“Nice job on Gruff in a browser and I think this will be a gamechanger.” – Louis Rumanes, United Health Group
“Few tools exist that can quickly turn arbitrary RDF graph pattern matches into clear visualizable results. Gruff is invaluable in turning our knowledge graph data into useful and actionable analytic insights.” – Michael Pool, BNY Mellon Bank
View the recording on YouTube/AllegroGraph.
View the slides on SlideShare – AllegroGraph.