Ontology Summit 2020 – Knowledge Graphs

The Ontology Summit is an annual series of events that involves the ontology community and communities related to each year’s theme chosen for the summit. The Ontology Summit was started by Ontolog and NIST, and the program has been co-organized by Ontolog, NIST, NCOR, NCBO, IAOA, NCO_NITRD along with the co-sponsorship of other organizations that are supportive of the Summit goals and objectives.

Knowledge graphs, closely related to ontologies and semantic networks, have emerged in the last few years to be an important semantic technology and research area. As structured representations of semantic knowledge that are stored in a graph, KGs are lightweight versions of semantic networks that scale to massive datasets such as the entire World Wide Web. Industry has devoted a great deal of effort to the development of knowledge graphs, and they are now critical to the functions of intelligent virtual assistants such as Siri and Alexa. Some of the research communities where KGs are relevant are Ontologies, Big Data, Linked Data, Open Knowledge Network, Artificial Intelligence, Deep Learning, and many others.

Dr. Jans Aasman presented – Why Knowledge Graphs Hit the Hype Cycle and What they have in common”

Presentation Page

Presentation Slides


Harnessing the Internet of Things with JSON-LD

Franz’s CEO, Jans Aasman’s recent IoT Evolution Article:

Conceptually, the promise of the Internet of Things is almost halcyon. Its billions of sensors are all connected, continuously transmitting data to support tailored, cost-saving measures maximizing revenues in applications as diverse as smart cities, smart price tags, and predictive maintenance in the Industrial Internet.

Practically, the data management necessities of capitalizing on this promise by the outset of the next decade are daunting. The vast majority of these datasets are unstructured or semi-structured. The data modeling challenges of rectifying their schema for integration are considerable. The low latency action required to benefit from their data implies machine intelligence largely elusive to today’s organizations.

…….

The self-describing, linked data approach upon which JSON-LD is founded excels at the low latent action resulting from machine to machine communication in the IoT. The nucleus of the linked data methodology—semantic statements and their unique Uniform Resource Identifiers (URIs)—are read and understood by machines. This characteristic aids many of the IoT use cases requiring machine intelligence; by transmitting IoT data via the JSON-LD format organizations can maximize this boon. Smart cities provide particularly compelling examples of the machine intelligence fortified by this expression of semantic technology.


Read the full article at IoT Evolution


Knowledge Graphs rise in Gartner’s Hype Cycle

“The 2019 Hype Cycle highlights the emerging technologies with significant impact on business, society and people over the next five to 10 years,” says Brian Burke, Research Vice President, Gartner. “Technology innovation is the key to competitive differentiation and is transforming many industries.”

This year’s emerging technologies fall into five major trends: Sensing and mobility, augmented human, postclassical compute and comms, digital ecosystems, and advanced AI and analytics.

Read the full Gartner press release.


AllegroGraph Replication on Amazon’s AWS using Terraform

Introduction

In this document we describe how to setup an AllegroGraph replication cluster on AWS using the terraform program. The cluster will have one controlling instance and a set of instances controlled by an Auto Scaling Group and reached via a Load Balancer.

diagram

Creating such a system on AWS takes a long time if done manually through their web interface. We have another document that takes you through the steps. Describing the system in terraform first takes a little time but once that’s done the cluster can be started in less than five minutes.

Steps

  1. Obtain an AMI with AllegroGraph and aws-repl (our support code for aws) installed.
  2. Edit the terraform file we supply to suit your needs
  3. Run terraform to build the cluster

Obtain an AMI with AllegroGraph and aws-repl

An AMI is an image of a virtual machine. You create an AMI by launching an ec2 instance using an AMI, altering the root disk of that instance and then telling AWS to create an AMI based on your instance. You can repeat this process until you create the AMI you need.

We have a prebuild AMI with all the code installed. It uses AllegroGraph 6.5.0 and doesn’t contain a license code so it’s limited to 5 million triples. You can use this AMI to test the load balancer or you can use this image as the starting off point for building your own image.

Alternatively you start from a fresh AMI and install everything yourself as described next.

We will create an AMI to run AllegroGraph with Replication with the following features

  1. When an EC2 instance running this AMI is started it starts AllegroGraph and joins the cluster of nodes serving a particular repository.
  2. When the the EC2 instance is terminated the instance sends a message to the controlling instance to ensure that the terminating instance is removed from the cluster
  3. If the EC2 instance is started at a particular IP address it creates the cluster and acts as the controlling instance of the cluster

This is a very simple setup but will serve many applications. For more complex needs you’ll need to write your own tools. Contact [email protected] to discuss support options.

The choice of AMI on which to build our AMI is not important except that our scripts assume that the initial account name of the image is ec2-user. Thus we suggest that you use one of the Amazon Linux images. If you use another kind of image you’ll need to do extra work (as an example we describe below how to use a Centos AMI). Since the instance we’ll build with the AMI are used only for AllegroGraph and not for other uses there’s no point in running a different version of Linux that you may use in your development work.

These are the steps to build an AMI:

Start an instance using an Amazon Linux AMI with EBS support.

We can’t specify the exact name of the image to start as the names change over time and depending on the region. We will usually pick one of the first images listed.

You don’t need to start a large virtual machine. A t2.micro will do.

You’ll need to specify a VPC and subnet. There should be a default VPC available. If not you’ll have to create one.

Make sure that when you specify that subnet that you want to external IP address.

Copy an agraph distribution (tar.gz format) to the ec2 instance into the home directory of ec2-user. Also copy the file aws-repl/aws-repl.tar to the home directory of ec2-user on the instance. aws-repl.tar contains scripts to support replication setup on AWS.

Extract the agraph repo in a temporary spot and run install-agraph in it, specifying the root of the agraph distribution.

I put it in /home/ec2-user/agraph

For example:

% mkdir tmp
% cd tmp
% tar xfz ../agraph-6.5.0-linuxamd64.64.tar.gz
% cd agraph-6.5.0
% ./install-agraph ~/agraph

Edit the file ~/agraph/lib/agraph.cfg and add the line

UseMainPortForSessions yes

This will allow sessions to be tracked through the Load Balancer.

If you have an agraph license key you should add it to the agraph.cfg file.

Unpack and install the aws-repl code:

% tar xf aws-repl.tar
% cd aws-repl
% sudo ./install.sh

You can delete aws-repl.tar but don’t delete the aws-repl directory. It will be used on startup.

Look at aws-repl/var.sh to see the parameter values. You’ll see an agraphroot parameter which should match where you installed agraph.

At this point the instance is setup.

You should go to the aws console, select this instance, and from the Action menu select “Image / Create Image”. Wait for the AMI to be built. At this time you can terminate the ec2 instance.

Using a CentOS 7 image:

If you wish to install on top of CentOS then you’ll need additional steps. The initial user on CentOS is called ‘centos’ rather than ‘ec2-user’. In order to keep things consistent we’ll create the ec2-user account and use that for running agraph just as we do for the Amazon AMI.

ssh to the ec2 vm as centos and do the following to create the ec2-user account and to allow ssh access to it just like the centos account

[centos@ip-10-0-1-227 ~]$ sudo sh

sh-4.2# adduser ec2-user
sh-4.2# cp -rp .ssh ~ec2-user
sh-4.2# chown -R ec2-user ~ec2-user/.ssh
sh-4.2# exit

[centos@ip-10-0-1-227 ~]

$

At this point you can copy the agraph distribution to the ec2 vm. Scp to [email protected] rather than [email protected]. Also copy the aws-repl.tar file.

The only change to the procedure is when you must run install.sh in the aws-repl directory.

The ec2-user account does not have the ability to sudo. So this command must be run

when logged in as the user centos;

centos@ip-10-0-1-227 ~]$ sudo sh
sh-4.2# cd ~ec2-user/aws-repl
sh-4.2# ./install.sh
+ cp joincluster /etc/rc.d/init.d
+ chkconfig --add joincluster
sh-4.2# exit

[centos@ip-10-0-1-227 ~]

$

Edit the terraform file we supply to suit your needs

Edit the file agelb.tf. This file contains directives to terraform to create the cluster with load balancer. At the top are the variables you can easily change. Other values are found inside the directives and you can change those as well.

Two variables you definitely need to change are

  1. ag-elb-ami” – this is the name of the AMI you created in the previous step or the AMI we supply.
  2. ssh-key” – this is the name of the ssh key pair you want to use in the instances created.

You may wish to change the region where you want the instances built (that value is in the provider clause at the top of the file) and if you do you’ll need to change the variable “azs”.

We suggest you try building the cluster with the minimum changes to verify it works and then customize it to your liking.

Run terraform to build the cluster

To build the cluster make sure your have an ~/.aws/config file with a default entry, such as

[default]
aws_access_key_id = AKIAIXXXXXXXXXXXXXXX
aws_secret_access_key = o/dyrxxxxxxxxxxxxxxxxxxxxxxxxxxxxxxxx

This is what terraform uses as credentials when it contacts AWS.

In order to use terraform the first time (or any time you change the provider clause in agelb.tf) run this command

% terraform init

Terraform will download the files appropriate for the provider you specified.

After that you can build your cluster with

% terraform apply

And watch the messages. If there are no errors terraform will wait for confirmation from you to proceed. Type yes to proceed, anything else to abort.

After terraform is finished you’ll see the address of the load balancer printed.

You can make changes the agelb.tf file and again ‘terraform apply ‘ and terraform will tell you what it needs to do to change things from how they are now to what the agelb.tf file specifies.

To delete everything terraform added type the command

% terraform destroy

And type yes when prompted.


SHACL – Shapes Constraint Language in AllegroGraph

SHACL is a SHApe Constraint Language. It specifies a vocabulary (using triples) to describe the shape that data should have. The shape specifies things like the following simple requirements:

  • How many triples with a specified subject and predicate should be in the repository (e.g. at least 1, at most 1, exactly 1).
  • What the nature of the object of a triple with a specified subject and predicate should be (e.g. a string, an integer, etc.)

See the specification for more examples.

SHACL allows you to validate that your data is conforming to desired requirements.

For a given validation, the shapes are in the Shapes Graph (where graph means a collection of triples) and the data to be validated is in the Data Graph (again, a collection of triples). The SHACL vocabularly describes how a given shape is linked to targets in the data and also provides a way for a Data Graph to specify the Shapes Graph that should be used for validatation. The result of a SHACL validation describes whether the Data Graph conforms to the Shapes Graph and, if it does not, describes each of the failures.

Namespaces Used in this Document

Along with standard predefined namespaces (such as rdf: for <http://www.w3.org/1999/02/22-rdf-syntax-ns#> and rdfs: for <http://www.w3.org/2000/01/rdf-schema#>), the following are used in code and examples below:

prefix fr: <https://franz.com#>  
prefix sh: <http://www.w3.org/ns/shacl#>  
prefix franz: <https://franz.com/ns/allegrograph/6.6.0/>  

A Simple Example

Suppose we have a Employee class and for each Employee instance, there must be exactly one triple of the form

emp001 hasID "000-12-3456" 

where the object is the employee’s ID Number, which has the format is [3 digits]-[2 digits]-[4 digits].

This TriG file encapsulates the constraints above:

@prefix sh: <http://www.w3.org/ns/shacl#> .  
@prefix xsd: <http://www.w3.org/2001/XMLSchema#> .  
 
<https://franz.com#Shapes> {  
 <https://franz.com#EmployeeShape>  
  a sh:NodeShape ;  
  sh:targetClass <https://franz.com#Employee> ;  
  sh:property [  
    sh:path <https://franz.com#hasID> ;  
    sh:minCount 1 ;  
    sh:maxCount 1 ;  
    sh:datatype xsd:string ;  
    sh:pattern "^[0-9][0-9][0-9]-[0-9][0-9]-[0-9][0-9][0-9][0-9]$" ;  
  ] .  
} 

It says that for instances of fr:Employee (sh:targetClass <https://franz.com#Employee>), there must be exactly 1 triple with predicate (path) fr:hasID and the object of that triple must be a string with pattern [3 digits]-[2 digits]-[4 digits] (sh:pattern "^[0-9][0-9][0-9]-[0-9][0-9]-[0-9][0-9][0-9][0-9]$").

This TriG file defines the Employee class and some employee instances:

@prefix fr: <https://franz.com#> .  
@prefix rdf: <http://www.w3.org/1999/02/22-rdf-syntax-ns#> .  
@prefix rdfs: <http://www.w3.org/2000/01/rdf-schema#> .  
 
{  
 fr:Employee  
  a rdfs:Class .  
 fr:emp001  
  a fr:Employee ;  
  fr:hasID "000-12-3456" ;  
  fr:hasID "000-77-3456" .  
 fr:emp002  
  a fr:Employee ;  
  fr:hasID "00-56-3456" .  
 fr:emp003  
  a fr:Employee .  
 } 

Recalling the requirements above, we immediately see these problems with these triples:

  1. emp001 has two hasID triples.
  2. The value of emp002‘s ID has the wrong format (two leading digits rather than 3).
  3. emp003 does not have a hasID triple.

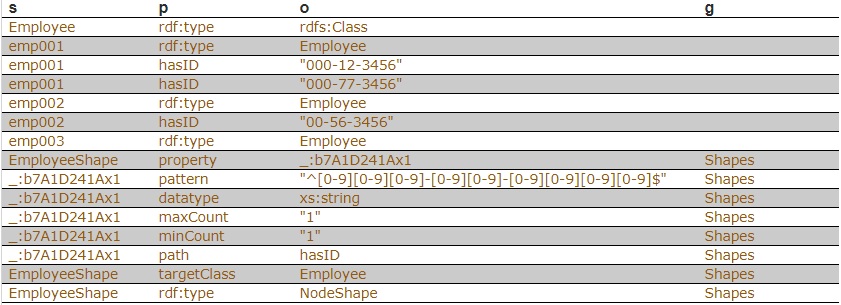
We load the two TriG files into our repository, and end up with the following triple set. Note that all the employee triples use the default graph and the SHACL-related triples use the graph <https://franz.com#Shapes> specified in the TriG file.

SHACL Triples

Now we use agtool shacl-validate to validate our data:

bin/agtool shacl-validate --data-graph default  --shapes-graph https://franz.com#Shapes shacl-repo-1  
Validation report:             Does not conform  
Created:                       2019-06-27T10:24:10  
Number of shapes graphs:       1  
Number of data graphs:         1  
Number of NodeShapes:          1  
Number of focus nodes checked: 3  
 
3 validation results:  
Result:  
 Focus node:           <https://franz.com#emp001>  
 Path:                 <https://franz.com#hasID>  
 Source Shape:         _:b7A1D241Ax1  
 Constraint Component: <http://www.w3.org/ns/shacl#MaxCountConstraintComponent>  
 Severity:             <http://www.w3.org/ns/shacl#Violation>  
 
Result:  
 Focus node:           <https://franz.com#emp002>  
 Path:                 <https://franz.com#hasID>  
 Value:                "00-56-3456"  
 Source Shape:         _:b7A1D241Ax1  
 Constraint Component: <http://www.w3.org/ns/shacl#PatternConstraintComponent>  
 Severity:             <http://www.w3.org/ns/shacl#Violation>  
 
Result:  
 Focus node:           <https://franz.com#emp003>  
 Path:                 <https://franz.com#hasID>  
 Source Shape:         _:b7A1D241Ax1  
 Constraint Component: <http://www.w3.org/ns/shacl#MinCountConstraintComponent>  
 Severity:             <http://www.w3.org/ns/shacl#Violation> 

The validation fails with the problems listed above. The Focus node is the subject of a triple that did not conform. Path is the predicate or a property path (predicates in this example). Value is the offending value. Source Shape is the shape that established the constraint (you must look at the shape triples to see exactly what Source Shape is requiring).

We revise our employee data with the following SPARQL expresssion, deleting one of the emp001 triples, deleting the emp002 triple and adding a new one with the correct format, and adding an emp003 triple.

prefix fr: <https://franz.com#>  
 
DELETE DATA {fr:emp002 fr:hasID "00-56-3456" } ;  
 
INSERT DATA {fr:emp002 fr:hasID "000-14-1772" } ;  
 
DELETE DATA {fr:emp001 fr:hasID "000-77-3456" } ;  
 
INSERT DATA {fr:emp003 fr:hasID "000-54-9662" } ; 

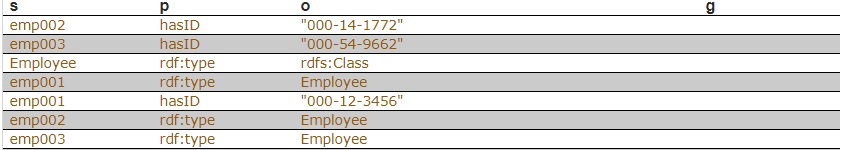
Now our employee triples are

SHACL Triples 2

We run the validation again and are told our data conforms:

% bin/agtool shacl-validate --data-graph default  --shapes-graph https://franz.com#Shapes shacl-repo-1  
Validation report:             Conforms  
Created:                       2019-06-27T10:32:19  
Number of shapes graphs:       1  
Number of data graphs:         1  
Number of NodeShapes:          1  
Number of focus nodes checked: 3 

When we refer to this example in the remainder of this document, it is to the un-updated (incorrect) triples.

SHACL API

The example above illustrates the SHACL steps:

  1. Have a data set with triples that should conform to a shape
  2. Have SHACL triples that express the desired shape
  3. Run SHACL validation to determine if the data conforms

Note that SHACL validation does not modify the data being validated. Once you have the conformance report, you must modify the data to fix the conformance problems and then rerun the validation test.

The main entry point to the API is agtool shacl-validate. It takes various options and has several output choices. Online help for agtool shacl-validate is displayed by running agtool shacl-validate --help.

In order to validate triples, the system must know:

  1. What tripes to examine
  2. What rules (SHACL triples) to use
  3. What to do with the results

Specifying what triples to examine

Two arguments to agtool shacl-validate specify the triples to evaluate: --data-graph and --focus-node. Each can be specified multiple times.

  • The --data-graph argument specifies the graph value for triples to be examined. Its value must be an IRI or default. Only triples in the specified graphs will be examined. default specifies the default graph. It is also the default value of the --data-graph argument. If no value is specified for --data-graph, only triples in the default graph will be examined. If a value for --data-graph is specified, triples in the default graph will only be examined if --data-graph default is also specified.
  • The --focus-node argument specifies IRIs which are subjects of triples. If this argument is specified, only triples with these subjects will be examined. To be examined, triples must also have graph values specified by --data-graph arguments. --focus-node does not have a default value. If unspecified, all triples in the specified data graphs will be examined. This argument can be specified multiple times.

The --data-graph argument was used in the simple example above. Here is how the --focus-node argument can be used to restrict validation to triples with subjects <https://franz.com#emp002>and <https://franz.com#emp003> and to ignore triples with subject <https://franz.com#emp001> (applying agtool shacl-validate to the orignal non-conformant data):

% bin/agtool shacl-validate --data-graph default  \  
  --shapes-graph https://franz.com#Shapes \  
  --focus-node https://franz.com#emp003 \  
  --focus-node https://franz.com#emp002 shacl-repo-1  
Validation report:             Does not conform  
Created:                       2019-06-27T11:37:49  
Number of shapes graphs:       1  
Number of data graphs:         1  
Number of NodeShapes:          1  
Number of focus nodes checked: 2  
 
2 validation results:  
Result:  
 Focus node:           <https://franz.com#emp003>  
 Path:                 <https://franz.com#hasID>  
 Source Shape:         _:b7A1D241Ax2  
 Constraint Component: <http://www.w3.org/ns/shacl#MinCountConstraintComponent>  
 Severity:             <http://www.w3.org/ns/shacl#Violation>  
 
Result:  
 Focus node:           <https://franz.com#emp002>  
 Path:                 <https://franz.com#hasID>  
 Value:                "00-56-3456"  
 Source Shape:         _:b7A1D241Ax2  
 Constraint Component: <http://www.w3.org/ns/shacl#PatternConstraintComponent>  
 Severity:             <http://www.w3.org/ns/shacl#Violation> 

Specifying What Shape Triples to Use

Two arguments to agtool shacl-validate, analogous to the two arguments for data described above, specify Shape triples to use. Further, following the SHACL spec, data triples with predicate <http://www.w3.org/ns/shacl#shapeGraph> also specify graphs containing Shape triples to be used.

The arguments to agtool shacl-validate are the following. Each may be specified multiple times.

  • The --shapes-graph argument specifies the graph value for shape triples to be used for SHACL validation. Its value must be an IRI or defaultdefault specifies the default graph. The --shapes-graph argument has no default value. If unspecified, graphs specified by data triples with the <http://www.w3.org/ns/shacl#shapeGraph> predicate will be used (they are used whether or not --shapes-graph has a value). If --shapes-graph has no value and there are no data triples with the <http://www.w3.org/ns/shacl#shapeGraph> predicate, the data graphs are used for shape graphs. (Shape triples have a known format and so can be identified among the data triples.)
  • The --shape argument specifies IRIs which are subjects of shape nodes. If this argument is specified, only shape triples with these subjects and subsiduary triples to these will be used for validation. To be included, the triples must also have graph values specified by the --shapes-graph arguments or specified by a data triple with the <http://www.w3.org/ns/shacl#shapeGraph> predicate. --shape does not have a default value. If unspecified, all shapes in the shapes graphs will be used.

Other APIs

There is a lisp API using the function validate-data-graph, defined next:

validate-data-graphdb  &key  data-graph-iri/s  shapes-graph-iri/s  shape/s  focus-node/s  verbose  conformance-only?

function

Perform SHACL validation and return a validation-report structure.

The validation uses data-graph-iri/s to construct the dataGraph. This can be a single IRI, a list of IRIs or NIL, in which case the default graph will be used. The shapesGraph can be specified using the shapes-graph-iri/s parameter which can also be a single IRI or a list of IRIs. If shape-graph-iri/s is not specified, the SHACL processor will first look to create the shapesGraph by finding triples with the predicate sh:shapeGraph in the dataGraph. If there are no such triples, then the shapesGraph will be assumed to be the same as the dataGraph.

Validation can be restricted to particular shapes and focus nodes using the shape/s and focus-node/s parameters. Each of these can be an IRI or list of IRIs.

If conformance-only? is true, then validation will stop as soon as any validation failures are detected.

You can use validation-report-conforms-p to see whether or not the dataGraph conforms to the shapesGraph (possibly restricted to just particular shape/s and focus-node/s).

The function validation-report-conforms-p returns t or nil as the validation struct returned by validate-data-graph does or does not conform.

validation-report-conforms-preport

function

Returns t or nil to indicate whether or not REPORT (a validation-report struct) indicates that validation conformed.

There is also a REST API. See HTTP reference.

Validation Output

The simple example above and the SHACL examples below show output from agtool validate-shacl. There are various output formats, specified by the --output option. Those examples use the plain format, which means printing results descriptively. Other choices include jsontrigtrixturtlenquadsrdf-n3rdf/xml, and ntriples. Here are the simple example (uncorrected) results using ntriples output:

% bin/agtool shacl-validate --output ntriples --data-graph default --shapes-graph https://franz.com#Shapes shacl-repo-1  
 
_:b271983AAx1 <http://www.w3.org/1999/02/22-rdf-syntax-ns#type> <http://www.w3.org/ns/shacl#ValidationReport> .  
_:b271983AAx1 <http://www.w3.org/ns/shacl#conforms> "false"^^<http://www.w3.org/2001/XMLSchema#boolean> .  
_:b271983AAx1 <http://purl.org/dc/terms/created> "2019-07-01T18:26:03"^^<http://www.w3.org/2001/XMLSchema#dateTime> .  
_:b271983AAx1 <http://www.w3.org/ns/shacl#result> _:b271983AAx2 .  
_:b271983AAx2 <http://www.w3.org/1999/02/22-rdf-syntax-ns#type> <http://www.w3.org/ns/shacl#ValidationResult> .  
_:b271983AAx2 <http://www.w3.org/ns/shacl#focusNode> <https://franz.com#emp001> .  
_:b271983AAx2 <http://www.w3.org/ns/shacl#resultPath> <https://franz.com#hasID> .  
_:b271983AAx2 <http://www.w3.org/ns/shacl#resultSeverity> <http://www.w3.org/ns/shacl#Violation> .  
_:b271983AAx2 <http://www.w3.org/ns/shacl#sourceConstraintComponent> <http://www.w3.org/ns/shacl#MaxCountConstraintComponent> .  
_:b271983AAx2 <http://www.w3.org/ns/shacl#sourceShape> _:b271983AAx3 .  
_:b271983AAx1 <http://www.w3.org/ns/shacl#result> _:b271983AAx4 .  
_:b271983AAx4 <http://www.w3.org/1999/02/22-rdf-syntax-ns#type> <http://www.w3.org/ns/shacl#ValidationResult> .  
_:b271983AAx4 <http://www.w3.org/ns/shacl#focusNode> <https://franz.com#emp002> .  
_:b271983AAx4 <http://www.w3.org/ns/shacl#resultPath> <https://franz.com#hasID> .  
_:b271983AAx4 <http://www.w3.org/ns/shacl#resultSeverity> <http://www.w3.org/ns/shacl#Violation> .  
_:b271983AAx4 <http://www.w3.org/ns/shacl#sourceConstraintComponent> <http://www.w3.org/ns/shacl#PatternConstraintComponent> .  
_:b271983AAx4 <http://www.w3.org/ns/shacl#sourceShape> _:b271983AAx3 .  
_:b271983AAx4 <http://www.w3.org/ns/shacl#value> "00-56-3456" .  
_:b271983AAx1 <http://www.w3.org/ns/shacl#result> _:b271983AAx5 .  
_:b271983AAx5 <http://www.w3.org/1999/02/22-rdf-syntax-ns#type> <http://www.w3.org/ns/shacl#ValidationResult> .  
_:b271983AAx5 <http://www.w3.org/ns/shacl#focusNode> <https://franz.com#emp003> .  
_:b271983AAx5 <http://www.w3.org/ns/shacl#resultPath> <https://franz.com#hasID> .  
_:b271983AAx5 <http://www.w3.org/ns/shacl#resultSeverity> <http://www.w3.org/ns/shacl#Violation> .  
_:b271983AAx5 <http://www.w3.org/ns/shacl#sourceConstraintComponent> <http://www.w3.org/ns/shacl#MinCountConstraintComponent> .  
_:b271983AAx5 <http://www.w3.org/ns/shacl#sourceShape> _:b271983AAx3 . 

You can have the triples added to the repository by specifying the --add-to-repo option true.

In the plain output information is provided about how many data graphs are examined, how many shape graphs were specified and node shapes are found, and how many focus nodes are checked. If zero focus nodes are checked, that is likely not what you want and something has gone wrong. Here we mis-spell the name of the shape graph (https://franz.com#shapes instead of https://franz.com#Shapes) and get 0 focus nodes checked:

% bin/agtool shacl-validate --data-graph default --shapes-graph https://franz.com#shapes shacl-repo-1  
Validation report:             Conforms  
Created:                       2019-06-28T10:34:22  
Number of shapes graphs:       1  
Number of data graphs:         1  
Number of NodeShapes:          0  
Number of focus nodes checked: 0  

SPARQL integration

There are two sets of magic properties defined: one checks for basic conformance and the other produces validation reports as triples:

  • ?valid franz:shaclConforms ( ?dataGraph [ ?shapesGraph ] )
  • ?valid franz:shaclFocusNodeConforms1 ( ?dataGraph ?nodeOrNodeCollection )
  • ?valid franz:shaclFocusNodeConforms2 ( ?dataGraph ?shapesGraph ?nodeOrNodeCollection )
  • ?valid franz:shaclShapeConforms1 ( ?dataGraph ?shapeOrShapeCollection [ ?nodeOrNodeCollection ] )
  • ?valid franz:shaclShapeConforms2 ( ?dataGraph ?shapesGraph ?shapeOrShapeCollection [ ?nodeOrNodeCollection ] )
  • (?s ?p ?o) franz:shaclValidationReport ( ?dataGraph [ ?shapesGraph ] )
  • (?s ?p ?o) franz:shaclFocusNodeValidationReport1 ( ?dataGraph ?nodeOrNodeCollection ) .
  • (?s ?p ?o) franz:shaclFocusNodeValidationReport2 ( ?dataGraph ?shapesGraph ?nodeOrNodeCollection ) .
  • (?s ?p ?o) franz:shaclShapeValidationReport1 ( ?dataGraph ?shapeOrShapeCollection [ ?nodeOrNodeCollection ] ) .
  • (?s ?p ?o) franz:shaclShapeValidationReport2 ( ?dataGraph ?shapesGraph ?shapeOrShapeCollection [ ?nodeOrNodeCollection ] ) .

In all of the above ?dataGraph and ?shapesGraph can be IRIs, the literal ‘default’, or a variable that is bound to a SPARQL collection (list or set) that was previously created with a function like https://franz.com/ns/allegrograph/6.5.0/fn#makeSPARQLList or https://franz.com/ns/allegrograph/6.5.0/fn#lookupRdfList. If a collection is used, then the SHACL processor will create a temporary RDF merge of all of the graphs in it to produce the data graph or the shapes graph.

Similarly, ?shapeOrShapeCollection and ?nodeOrNodeCollection can be bound to an IRI or a SPARQL collection. If a collection is used, then it must be bound to a list of IRIs. The SHACL processor will restrict validation to the shape(s) and focus node(s) (i.e. nodes that should be validated) specified.

The shapesGraph argument is optional in both of the shaclConforms and shaclValidationReport magic properties. If the shapesGraph is not specified, then the shapesGraph will be created by following triples in the dataGraph that use the sh:shapesGraph predicate. If there are no such triples, then the shapesGraph will be the same as the dataGraph.

For example, the following SPARQL expression

construct { ?s ?p ?o } where {  
  # form a collection of focusNodes  
  bind(<https://franz.com/ns/allegrograph/6.6.0/fn#makeSPARQLList>(  
    <http://Journal1/1942/Article25>,  
    <http://Journal1/1943>) as ?nodes)  
  (?s ?p ?o) <https://franz.com/ns/allegrograph/6.6.0/shaclShapeValidationReport1>  
    ('default' <ex://franz.com/documentShape1> ?nodes) .  
} 

would use the default graph as the Data Graph and the Shapes Graph and then validate two focus nodes against the shape <ex://franz.com/documentShape1>.

SHACL Example

We build on our simple example above. Start with a fresh repository so triples from the simple example do not interfere with this example.

We start with a TriG file with various shapes defined on some classes.

@prefix sh: <http://www.w3.org/ns/shacl#> .  
@prefix xsd: <http://www.w3.org/2001/XMLSchema#> .  
@prefix fr: <https://franz.com#> .  
@prefix rdf: <http://www.w3.org/1999/02/22-rdf-syntax-ns#> .  
@prefix rdfs: <http://www.w3.org/2000/01/rdf-schema#> .  
 
<https://franz.com#ShapesGraph> {  
fr:EmployeeShape  
   a sh:NodeShape ;  
   sh:targetClass fr:Employee ;  
   sh:property [  
     ## Every employee must have exactly one ID  
     sh:path fr:hasID ;  
     sh:minCount 1 ;  
     sh:maxCount 1 ;  
     sh:datatype xsd:string ;  
     sh:pattern "^[0-9][0-9][0-9]-[0-9][0-9]-[0-9][0-9][0-9][0-9]$" ;  
    ] ;  
   sh:property [  
     ## Every employee is a manager or a worker  
     sh:path fr:employeeType ;  
     sh:minCount 1 ;  
     sh:maxCount 1 ;  
     sh:datatype xsd:string ;  
     sh:in ("Manager" "Worker") ;  
    ] ;  
    sh:property [  
      ## If birthyear supplied, must be 2001 or before  
      sh:path fr:birthYear ;  
      sh:maxInclusive 2001 ;  
      sh:datatype xsd:integer ;  
    ] ;  
    sh:property [  
      ## Must have a title, may have more than one  
      sh:path fr:hasTitle ;  
      sh:datatype xsd:string ;  
      sh:minCount 1 ;  
    ] ;  
 
    sh:or (  
      ## The President does not have a supervisor  
      [  
        sh:path fr:hasTitle ;  
        sh:hasValue "President" ;  
      ]  
      [  
       ## Must have a supervisor  
         sh:path fr:hasSupervisor ;  
         sh:minCount 1 ;  
         sh:maxCount 1 ;  
         sh:class fr:Employee ;  
      ]  
      ) ;  
 
    sh:or (  
      # Every employee must either have a wage or a salary  
      [  
       sh:path fr:hasSalary ;  
       sh:datatype xsd:integer ;  
       sh:minInclusive 3000 ;  
       sh:minCount 1 ;  
       sh:maxCount 1 ;  
      ]  
      [  
       sh:path fr:hasWage ;  
       sh:datatype xsd:decimal ;  
       sh:minExclusive 15.00 ;  
       sh:minCount 1 ;  
       sh:maxCount 1 ;  
      ]  
    )  
    .  
   } 

This file says the following about instances of the class fr:Employee:

  1. Every employee must have exactly one ID (object of fr:hasID), a string of the form NNN-NN-NNNN where the Ns are digits (this is the simple example requirement).
  2. Every employee must have exactly one fr:employeeType triple with value either “Manager” or “Worker”.
  3. Employees may have a fr:birthYear triple, and if so, the value must be 2001 or earlier.
  4. Employees must have a fr:hasTitle and may have more than one.
  5. All employees except the one with title “President” must have a supervisor (specified with fr:hasSupervisor).
  6. Every employee must either have a wage (a decimal specifying hourly pay, greater than 15.00) or a salary (an integer specifying monthly pay, greater than or equal to 3000).

Here is some employee data:

@prefix fr: <https://franz.com#> .  
@prefix rdf: <http://www.w3.org/1999/02/22-rdf-syntax-ns#> .  
@prefix rdfs: <http://www.w3.org/2000/01/rdf-schema#> .  
@prefix xsd: <http://www.w3.org/2001/XMLSchema#> .  
 
{  
 fr:Employee  
  a rdfs:Class .  
 
 fr:emp001  
  a fr:Employee ;  
  fr:hasID "000-12-3456" ;  
  fr:hasTitle "President" ;  
  fr:employeeType "Manager" ;  
  fr:birthYear "1953"^^xsd:integer ;  
  fr:hasSalary "10000"^^xsd:integer .  
 
 fr:emp002  
  a fr:Employee ;  
  fr:hasID "000-56-3456" ;  
  fr:hasTitle "Foreman" ;  
  fr:employeeType "Worker" ;  
  fr:birthYear "1966"^^xsd:integer ;  
  fr:hasSupervisor fr:emp003 ;  
  fr:hasWage "20.20"^^xsd:decimal .  
 
 fr:emp003  
  a fr:Employee ;  
  fr:hasID "000-77-3232" ;  
  fr:hasTitle "Production Manager" ;  
  fr:employeeType "Manager" ;  
  fr:birthYear "1968"^^xsd:integer ;  
  fr:hasSupervisor fr:emp001 ;  
  fr:hasSalary "4000"^^xsd:integer .  
 
 fr:emp004  
  a fr:Employee ;  
  fr:hasID "000-88-3456" ;  
  fr:hasTitle "Fitter" ;  
  fr:employeeType "Worker" ;  
  fr:birthYear "1979"^^xsd:integer ;  
  fr:hasSupervisor fr:emp002 ;  
  fr:hasWage "17.20"^^xsd:decimal .  
 
 fr:emp005  
  a fr:Employee ;  
  fr:hasID "000-99-3492" ;  
  fr:hasTitle "Fitter" ;  
  fr:employeeType "Worker" ;  
  fr:birthYear "2000"^^xsd:integer ;  
  fr:hasWage "17.20"^^xsd:decimal .  
 
 fr:emp006  
  a fr:Employee ;  
  fr:hasID "000-78-5592" ;  
  fr:hasTitle "Filer" ;  
  fr:employeeType "Intern" ;  
  fr:birthYear "2003"^^xsd:integer ;  
  fr:hasSupervisor fr:emp002 ;  
  fr:hasWage "14.20"^^xsd:decimal .  
 
 fr:emp007  
  a fr:Employee ;  
  fr:hasID "000-77-3232" ;  
  fr:hasTitle "Sales Manager" ;  
  fr:hasTitle "Vice President" ;  
  fr:employeeType "Manager" ;  
  fr:birthYear "1962"^^xsd:integer ;  
  fr:hasSupervisor fr:emp001 ;  
  fr:hasSalary "7000"^^xsd:integer .  
 } 

Comparing these data with the requirements, we see these problems:

  1. emp005 does not have a supervisor.
  2. emp006 is pretty messed up, with (1) employeeType “Intern”, not an allowed value, (2) a birthYear (2003) later than the required maximum of 2001, and (3) a wage (14.40) less than the minimum (15.00).

Otherwise the data seems OK.

We load these two TriG files into an emply repository (which we have named shacl-repo-2). We specify the default graph for the data and the https://franz.com#ShapesGraph for the shapes. (Though not required, it is a good idea to specify a graph for shape data as it makes it easy to delete and reload shapes while developing.) We have 101 triples, 49 data and 52 shape. Then we run agtool shacl-validate:

% bin/agtool shacl-validate --shapes-graph https://franz.com#ShapesGraph --data-graph default shacl-repo-2 

There are four violations, as expected, one for emp005 and three for emp006.

Validation report:             Does not conform  
Created:                       2019-07-03T11:35:27  
Number of shapes graphs:       1  
Number of data graphs:         1  
Number of NodeShapes:          1  
Number of focus nodes checked: 7  
 
4 validation results:  
Result:  
 Focus node:           <https://franz.com#emp005>  
 Value:                <https://franz.com#emp005>  
 Source Shape:         <https://franz.com#EmployeeShape>  
 Constraint Component: <https://www.w3.org/ns/shacl#OrConstraintComponent>  
 Severity:             <https://www.w3.org/ns/shacl#Violation>  
 
Result:  
 Focus node:           <https://franz.com#emp006>  
 Path:                 <https://franz.com#employeeType>  
 Value:                "Intern"  
 Source Shape:         _:b19D062B9x221  
 Constraint Component: <http://www.w3.org/ns/shacl#InConstraintComponent>  
 Severity:             <http://www.w3.org/ns/shacl#Violation>  
 
Result:  
 Focus node:           <https://franz.com#emp006>  
 Path:                 <https://franz.com#birthYear>  
 Value:                "2003"^^<http://www.w3.org/2001/XMLSchema#integer>  
 Source Shape:         _:b19D062B9x225  
 Constraint Component: <http://www.w3.org/ns/shacl#MaxInclusiveConstraintComponent>  
 Severity:             <http://www.w3.org/ns/shacl#Violation>  
 
Result:  
 Focus node:           <https://franz.com#emp006>  
 Value:                <https://franz.com#emp006>  
 Source Shape:         <https://franz.com#EmployeeShape>  
 Constraint Component: <http://www.w3.org/ns/shacl#OrConstraintComponent>  
 Severity:             <http://www.w3.org/ns/shacl#Violation>  

Fixing the data is left as an exercise for the reader.


Turn Customer Service Calls into Enterprise Knowledge Graphs

Franz’s CEO, Jans Aasman’s recent Destination CRM article:

The need for text analytics and speech recognition has broadened over the years, becoming more prevalent and essential in the sales, marketing, and customer service departments of various types of businesses and industries. The goal is simple for these contact center use cases: provide real-time assistance to human agents interacting with potential customers to close sales, initiate them, and increase customer satisfaction.

Until fairly recently, the rich array of unstructured data encompassing client texts, chats, and phone calls was obscured from contact centers and organizations due to the sheer arduousness of speech recognition and text analytics. When readily integrated into knowledge graphs, however, these same sources become some of the most credible for improving agent interactions and achieving business objectives.

Powered by the shrewd usage of organizational taxonomies, machine learning, natural language processing (NLP), and semantic search, knowledge graphs make speech recognition and text analytics immediately accessible, enabling real-time customer interactions that can maximize business objectives—and revenues.

Taxonomies

Taxonomies are the foundation of the knowledge graph approach to rapidly conveying results of speech recognition and text analytics for timely customer interactions. Agents need three types of information to optimize customer interactions: their personas (such as an executive or a purchase department representative, for example), their reasons for contacting them, and their industries. Taxonomies are instrumental to performing these functions because they provide a hierarchy of relevant terms to organizations.

Read the full article at Destination CRM


AllegroGraph Named to DBTA Top 100 That Matter Most in Data

Franz Inc., an early innovator in Artificial Intelligence (AI) and leading supplier of Graph and Document Database technology for Knowledge Graphs, today announced that it has been named to Database Trends and Applications (DBTA) – 2019 Top 100 That Matter Most in Data.

“We’re excited to announce our seventh annual list, as the industry continues to grow and evolve,” remarked Thomas Hogan, Group Publisher at Database Trends and Applications. “Today, more than ever, businesses are looking to increase their efficiency, agility and ability to innovate by managing and leveraging data in new and novel ways. This list seeks to highlight those companies that have been successful in establishing themselves as unique resources for data professionals and stakeholders.”

“We are honored to receive this acknowledgement for our efforts in delivering Enterprise Knowledge Graph Solutions,” said Dr. Jans Aasman, CEO, Franz Inc. “In the past year, we have seen demand for Enterprise Knowledge Graphs take off across industries along with recognition from top technology analyst firms that Knowledge Graphs provide the critical foundation for artificial intelligence applications and predictive analytics. Our AllegroGraph Knowledge Graph Platform Solution offers a unique comprehensive approach for helping companies accelerate the creation of Enterprise Knowledge Graphs that deliver new value to their organization.”

Franz’s Knowledge Graph Platform Solution includes both technology and services for building industrial strength Knowledge Graphs based on best-of-class tools, products, knowledge, skills and experience. At the core of the solution is Franz’s graph database technology, AllegroGraph, which is utilized by dozens of the top F500 companies worldwide and enables businesses to extract sophisticated decision insights and predictive analytics from highly complex, distributed data that cannot be uncovered with conventional databases.

Franz delivers the expertise for designing ontology and taxonomy-based solutions by utilizing standards-based development processes and tools. Franz also offers data integration services from siloed data using W3C industry standard semantics, which can then be continually integrated with information that comes from other data sources. In addition, the Franz data science team provides expertise in custom algorithms to maximize data analytics and uncover hidden knowledge.

Companies Across the Globe Use Franz Knowledge Graph Solutions

Organizations in customer service, healthcare, life science, publishing and technology have relied on Franz to help develop their knowledge graph solutions.

Global B2B technology firm N3 Results has utilized Franz’s Knowledge Graph Solution to build an ‘Intelligent Sales Organization,’ which uses graph based technology for taxonomy driven entity extraction, speech recognition, machine learning and predictive analytics to improve quality of conversations, increase sales and improve business visibility.

“In a typical sales organization, the valuable content within the online chat or voice conversation between the agent and customer goes into a black hole,” said Shannon Copeland, COO of N3. “Franz helped us build a modern Intelligent Sales Organization (ISO) by creating a real-time Knowledge Graph that knows everything about customers and agents and provides the raw data for machine learning to improve doing the business of ISO. Now we use the rich information between agents and customers to improve the quality of the interaction in real time, which ultimately creates more sales and provides far better analytics for management.”

In 2015, Dr. Parsa Mirhaji, his colleagues and industry partners, including Franz Inc. embarked on a project to bring Knowledge Graph technology to Montefiore, a Bronx-based medical center. “Our strategy at Montefiore is to build a data-driven and evidence-based health system – essentially a learning healthcare system – that can understand its own population thoroughly, understand and improve its practices, and develop the highest quality of services for the people it serves,” said Parsa Mirhaji, MD, PhD, Director of the Center for Health Data Innovations at Montefiore and the Albert Einstein College of Medicine. “In order to accomplish that goal, we have created a system that harvests every piece of data that we can possibly find, from our own EMRs and devices to patient-generated data to socioeconomic data from the community. It’s extremely important to use anything we can find that can help us categorize our patients more accurately.” (Health IT Analytics, At Montefiore, Artificial Intelligence Becomes Key to Patient Care, September 10, 2018)

Wolters Kluwer is using graph analytic techniques to accelerate the knowledge discovery process for its clients. “What we’re really interested in is achieving insights that today take a person to analyze and that are prohibitive computationally,” said Greg Tatham, Wolters Kluwer CTO of Global Platforms. “We’re providing this live feedback. As you’re typing, we’re providing question and suggestions for you live. AllegroGraph gives us a performant way to be able to just work our way through the whole knowledge model and come up with suggestions to the user in real time.” (Datanami, How AI Boosts Human Expertise at Wolters Kluwer, June 6, 2018)

Gartner Identifies Knowledge Graphs and Semantics as Key Technologies for AI
Gartner recently recognized knowledge graphs as a key new technology in both their Hype Cycle for Artificial Intelligence and Hype Cycle for Emerging Technologies. Gartner’s Hype Cycle for Artificial Intelligence 2018 states, “The rising role of content and context for delivering insights with AI technologies, as well as recent knowledge graph offerings for AI applications have pulled knowledge graphs to the surface.”

Semantics has also been identified by Gartner as critical for effectively utilizing enterprise data assets. “Unprecedented levels of data scale and distribution are making it almost impossible for organizations to effectively exploit their data assets. Data and analytics leaders must adopt a semantic approach to their enterprise data assets or face losing the battle for competitive advantage.” (Gartner, How to Use Semantics to Drive the Business Value of Your Data, Guido De Simoni, November 27, 2018) For more information about the Gartner report, visit the Gartner Report Order Page.

About Franz Inc.
Franz Inc. is an early innovator in Artificial Intelligence (AI) and leading supplier of Semantic Graph Database technology with expert knowledge in developing and deploying Knowledge Graph solutions. The foundation for Knowledge Graphs and AI lies in the facets of semantic technology provided by AllegroGraph and Allegro CL. The ability to rapidly integrate new knowledge is the crux of the Knowledge Graph and Franz Inc. provides the key technologies and services to address your complex challenges. Franz Inc. is your Knowledge Graph technology partner.

About Database Trends and Applications
Database Trends and Applications (DBTA), published by Information Today, Inc., is a bimonthly magazine that delivers advanced trends analysis and case studies in data management and analysis developed by a team with more than 25 years of industry experience. Visit www.dbta.com for subscription information. DBTA also delivers groundbreaking market research exclusively through its Unisphere Research group.


Gruff Time Machine Tutorial

Here is an example for trying out the new time slider in Gruff’s graph view. It uses triples from crunchbase.com that contain a history of corporate acquisitions and funding events over several years. Gruff’s time bar allows you to examine those events chronologically, and also to display only the nodes that have events within a specified date range.


  • Create a new triple-store and used “File | Load Triples | Load
    N-Triples” to load that triples file into the new triple-store. Use
    “File | Commit” to ensure that the loaded triples get saved.


  • Select “Visual Graph Options | Time Bar | Momentary Time Predicates”
    and paste the following five predicate IRIs into the dialog that
    appears. The time bar will then work with the date properties that
    are provided by these predicates, whenever you are browsing this
    particular triple-store.

http://www.franz.com/hasfunded_at
http://www.franz.com/hasfirst_funding_at
http://www.franz.com/hasfounded_at
http://www.franz.com/haslast_funding_at
http://www.franz.com/hasacquired_at

  • Select “View | Optional Graph View Panes | Show Time Bar” to reveal
    the time bar at the bottom of the graph view. The keyboard shortcut
    for this command is Shift+A to allow quickly toggling the time bar
    on and off.


  • Select “Display | Display Some Sample Triples” to do just that. The
    time bar will now display a vertical line for each of the requested
    date properties of the displayed nodes. Moving the mouse cursor
    over these “date property markers” will display more information
    about those events.


  • Click down on the yellow-orange rectangle at the right end of the
    time bar and drag it to the left. This will make the “time filter
    range” smaller, and nodes that have date properties that are no
    longer in this range will temporarily disappear from the display.
    They will reappear if you drag the slider back to the right or
    toggle the time bar back off.

For more information, the full time bar introduction is in the Gruff documentation under the command “View | Optional Graph View Panes | Show Time Bar”.

Check out the “Chart Widget” for showing date properties of the visible nodes.


Why Smart Cities Need AI Knowledge Graphs

A linked data framework can empower smart cities to realize social, political, and financial goals.

Smart cities are projected to become one of the most prominent manifestations of the Internet of Things (IoT). Current estimates for the emerging smart city market exceed $40 trillion, and San Jose, Barcelona, Singapore, and many other major metropolises are adopting smart technologies.

The appeal of smart cities is binary. On the one hand, the automated connectivity of the IoT is instrumental in reducing costs associated with public expenditures for infrastructure such as street lighting and transportation. With smart lighting, municipalities only pay for street light expenses when people are present. Additionally, by leveraging options for dynamic pricing with smart parking, for example, the technology can provide new revenue opportunities.

Despite these advantages, smart cities demand extensive data management. Consistent data integration from multiple locations and departments is necessary to enable interoperability between new and legacy systems. Smart cities need granular data governance for long-term sustainability. Finally, they necessitate open standards to future-proof their perpetual utility.

Knowledge graphs—enterprise-wide graphs which link all data assets for internal or external use—offer all these benefits and more. They deliver a uniform, linked framework for sharing data in accordance with governance protocols, are based on open standards, and exploit relationships between data for business and operational optimization. They supply everything smart cities need to realize their social, political, and financial goals. Knowledge graphs can use machine learning to reinsert the output of contextualized analytics into the technology stack, transforming the IoT’s copious data into foundational knowledge to spur improved civic applications.

Read the full article at Trajectory Magazine


New Gruff v7.4 – Now Available!

DOWNLOAD – Gruff

Gruff is the Knowledge Graph industry’s leading Graph Visualization software for exploring and discovering connections within data. Gruff provides novice users and graph experts the ability to visually build queries and explore connections as they developed over time.

Gruff produces dynamic data visualizations that organize connections between data in views that are driven by the user. This visual flexibility can instantly unveil new discoveries and knowledge that turn complex data into actionable business insights. Gruff was developed by Franz to address Graph Search in large data sets and empower users to intelligently explore graphs in multiple views including:

  • Graphical View with “Time Machine” feature – See the shape and density of graph data evolve over time
  • Tabular view – Understand objects as a whole
  • Outline view – Explore the often hierarchical nature of graphs
  • Query view – Write Prolog or SPARQL queries
  • Graphical Query Builder – Create queries visually via drag and drop

Gruff’s  ‘Time Machine’ feature provides users an important capability to explore temporal connections in your data.  Users can see how relationships are created over time and are able to replay the evolving graph for new temporal based insights.


Key New Features and Updates in Gruff v7.4 – To see the full list – Release Notes.

  • The new command “File | Connect to Gruff Demo Server” lets you try out Gruff on the “extended actors” database at a public AllegroGraph server that’s provided by Franz, when you don’t have an AllegroGraph server yourself. See the Example button in the query view and in the graphical query view for a few example queries. “Help | Animated Demo” also works there.
  • The graphical query view has new grouper boxes for graph group graph pattens, either for a particular graph or for a graph variable.
  • The graphical query view now has node filters for the SPARQL operators IN and NOT IN (for limiting a node variable to a particular set of values), for langMatches (for selecting only literals of a particular language), and for CONTAINS, STRSTARTS, and STRENDS (for finding literals that contain specified text). Also, the “bound” and “not bound” filters were broken, and the LIMIT and OFFSET values will now be included when saving a graphical query.
  • Gruff can now connect to AllegroGraph servers through an HTTP proxy (as was possible with SPARQL endpoints already). See Global Options | Communications | HTTP Proxy.
  • Additional triple file formats can now be loaded with the new commands “File | Load Triples | Load JSON-LD”, “Load TriG”, and “Load N-Quads Extended”. Corresponding new commands are also on the “File | Export Displayed Data As” child menu. Also, the new command “Global Options | Miscellaneous | Commit Frequency When Loading Triples” lets you control whether and how often commits will happen during loading.
  • The query view’s “Create Visual Graph” button will now create link lines for additional SPARQL property path operators, namely InversePath ( ^ ) and AlternativePath ( | ). And it will draw the correct character for ZeroOrOnePath ( ? ). (See “Query Options | Show Links for Property Paths in Visual Graphs” for turning this off.)
  • If the triple store defines label properties for predicates, then Gruff will now display those labels for the predicate objects as it has always done for nodes, as long as “Global Options | Node Label Predicates | Use Label Predicates for Node Labels” is on.
  • When “Visual Graph Options | Node Labels | Show Full URIs on Nodes” is on, full URIs will be also displayed for the predicates in link labels. And full URIs will be shown in the legend as well.

Gruff Documentation