Optimizing Fraud Management with AI Knowledge Graphs

From Global Banking and Finance Review – July 12, 2018

This article discusses Knowledge Graphs for Anti-Money Laundering (AML), Suspicious Activity Reports (SAR), counterfeiting and social engineering falsities, as well as synthetic, first-party, and card-not-present fraud.

By compiling fraud-related data into an AI knowledge graph, risk management personnel can also triage those alerts for the right action at the right time. They also get the additive benefit of reusing this graph to decrease other risks for security, loans, or additional financial purposes.

Dr. Aasman goes on to note:

By incorporating AI, these threat maps yields a plethora of information for actually preventing fraud. Supervised learning methods can readily identify what events constitute fraud and which don’t; many of these involve classic machine learning.  Unsupervised learning capabilities are influential in determining normal user behavior then pinpointing anomalies contributing to fraud. Perhaps the most effective way AI underpins risk management knowledge graphs is in predicting the likelihood—and when—a specific fraud instance will take place. Once organizations have data for customers, events, and fraud types over a length of time (which could be in as little as a month in the rapidly evolving financial crimes space), they can compute the co-occurrence between events and fraud types.

Read the full article over at Global Banking and Finance Review.


The Cornerstone of Data Science: Progressive Data Modeling

From AI Business June 27, 2018

This article covers Single Schema, Universal Taxonomies, Time Series Analysis, Accelerating Data Science and features some thought leadership from Franz Inc.’s CEO, Jans Aasman:

‘Contemporary data science and artificial intelligence requirements simply can’t wait for this ongoing, dilatory process. According to Jans Aasman, CEO of Franz, they no longer have to. By deploying what Aasman called an “events-based approach to schema”, companies can model datasets with any number of differences alongside one another for expedited enterprise value.’

‘The resulting schema is simplified, uniform, and useful in multiple ways. “You achieve two goals,” Aasman noted. “One is you define what data you trust to be in the main repository to have all the truth. The second thing is you make your data management a little more uniform. By doing those two things your AI and your data science will become better, because the data that goes into them is better.”’

Dr. Aasman goes on to note:

‘The events-based schema methodology only works with enterprise taxonomies—or at least with taxonomies spanning the different sources included in a specific repository, such as a Master Data Management hub. Taxonomies are necessary so that “the type of event can be specified,” Aasman said.’

‘Moreover, taxonomies are indispensable for clarifying terms and their meaning across different data formats, which may represent similar concepts in distinct ways. Therefore, practically all objects in a database should be “taxonomy based” Aasman said, because these hierarchical classifications enable organizations to query their repositories via this uniform schema.’

Read the full article over at AI Business.


How AI Boosts Human Expertise at Wolters Kluwer

Wolters Kluwer, a long time AllegroGraph customer, recently spoke with Alex Woodie at Datanami to describe how they are using AI tools such at AllegroGraph:

Thousands of companies around the world rely on Wolters Kluwer’s practice management software to automate core aspects of their businesses. That includes doctor’s offices that use its software make healthcare decisions in a clinical setting, corporate law offices that use its software to understand M&A activities, and accounting firms that use its software to craft tax strategies for high net-worth clients.

Wolters Kluwer is embedding a range of AI capabilities – including deep learning and graph analytics — across multiple product lines. For example, its Legalview Bill Analyzer software helps to identify errors in legal bills sent from outside law firms to the corporate counsels of large companies. The typical recovery rate for people reviewing bills manually is 1% to 2%. By adding machine learning technology to the product the recovery rate jumps to 7% to 8%, which can translate into tens of millions of dollars.

Wolters Kluwer is using graph analytic techniques to accelerate the knowledge discovery process for its clients across various professions. The company has tapped Franz‘s AllegroGraph software to help it drive new navigational tools for helping customers find answers to their questions.

By arranging known facts and concepts as triples in the AllegroGraph database and then exposing those structures to users through a traditional search engine dialog box, Wolters Kluwer is able to surface related insights in a much more interactive manner.

“We’re providing this live feedback. As you’re typing, we’re providing question and suggestions for you live,” Tatham said. “AllegroGraph gives us a performant way to be able to just work our way through the whole knowledge model and come up with suggestion to the user in real time.”

Read the full article over at Datanami.


Gruff Time Machine Tutorial

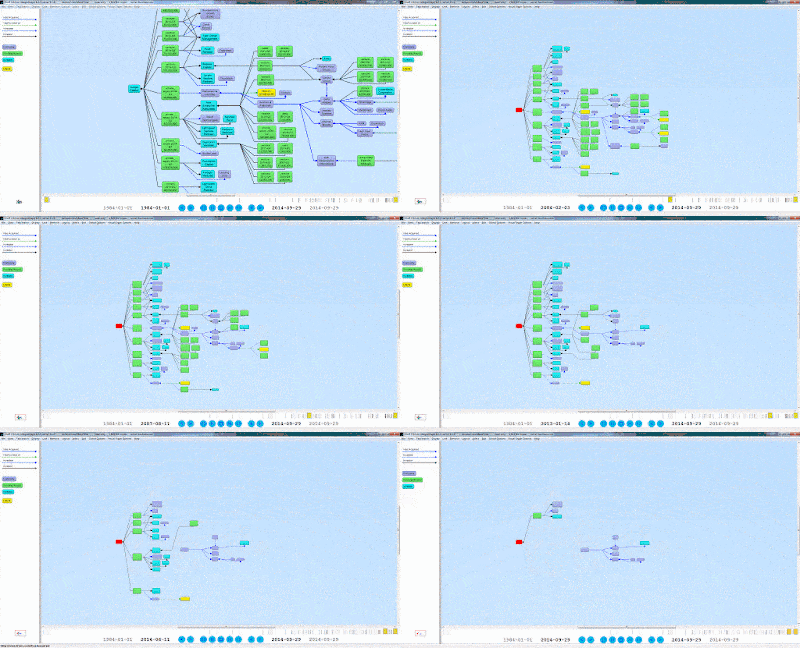
Here is an example for trying out the new time slider in Gruff’s graph view. It uses triples from crunchbase.com that contain a history of corporate acquisitions and funding events over several years. Gruff’s time bar allows you to examine those events chronologically, and also to display only the nodes that have events within a specified date range.


  • Create a new triple-store and used “File | Load Triples | Load
    N-Triples” to load that triples file into the new triple-store. Use
    “File | Commit” to ensure that the loaded triples get saved.


  • Select “Visual Graph Options | Time Bar | Momentary Time Predicates”
    and paste the following five predicate IRIs into the dialog that
    appears. The time bar will then work with the date properties that
    are provided by these predicates, whenever you are browsing this
    particular triple-store.

http://www.franz.com/hasfunded_at
http://www.franz.com/hasfirst_funding_at
http://www.franz.com/hasfounded_at
http://www.franz.com/haslast_funding_at
http://www.franz.com/hasacquired_at

  • Select “View | Optional Graph View Panes | Show Time Bar” to reveal
    the time bar at the bottom of the graph view. The keyboard shortcut
    for this command is Shift+A to allow quickly toggling the time bar
    on and off.


  • Select “Display | Display Some Sample Triples” to do just that. The
    time bar will now display a vertical line for each of the requested
    date properties of the displayed nodes. Moving the mouse cursor
    over these “date property markers” will display more information
    about those events.


  • Click down on the yellow-orange rectangle at the right end of the
    time bar and drag it to the left. This will make the “time filter
    range” smaller, and nodes that have date properties that are no
    longer in this range will temporarily disappear from the display.
    They will reappear if you drag the slider back to the right or
    toggle the time bar back off.

For more information, the full time bar introduction is in the Gruff documentation under the command “View | Optional Graph View Panes | Show Time Bar”.

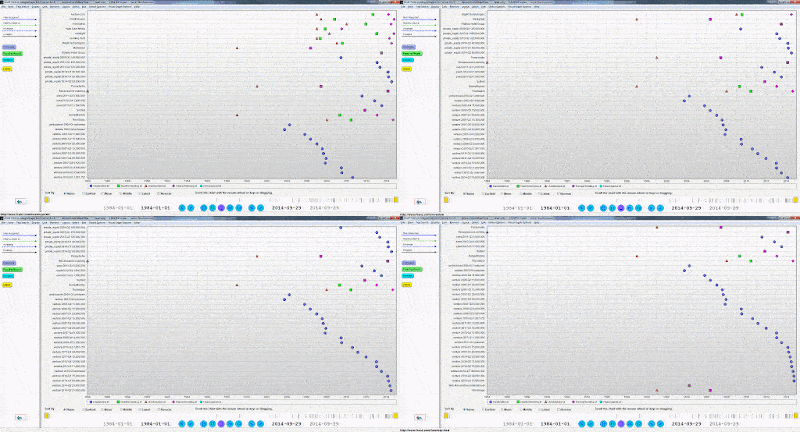
Check out the “Chart Widget” for showing date properties of the visible nodes.