AllegroGraph named to 2019 Trend-Setting Products

Database Trends and Applications –  December 2018

You can call it the new oil, or even the new electricity, but however it is described, it’s clear that data is now recognized as an essential fuel flowing through organizations and enabling never before seen opportunities. However, data cannot simply be collected; it must be handled with care in order to fulfill the promise of faster, smarter decision making.

More than ever, it is critical to have the right tools for the job. Leading IT vendors are coming forward to help customers address the data-driven possibilities by improving self-service access, real-time insights, governance and security, collaboration, high availability, and more.

To help showcase these innovative products and services each year, Database Trends and Applications magazine looks for offerings that promise to help organizations derive greater benefit from their data, make decisions faster, and work smarter and more securely.

This year our list includes newer approaches leveraging artificial intelligence, machine learning, and automation as well as products in more established categories such as relational and NoSQL database management, MultiValue, performance management, analytics, and data governance.


Read the AllegroGraph Spotlight


Knowledge Graphs — The path to true AI

Published in SD Times – December, 2018

Knowledge is the foundation of intelligence— whether artificial intelligence or conventional human intellect. The understanding implicit in intelligence, its application towards business problems or personal ones, requires knowledge of these problems (and potential solutions) to effectively overcome them.

The knowledge underpinning AI has traditionally come from two distinct methods: statistical reasoning, or machine learning, and symbolic reasoning based on rules and logic. The former approach learns by correlating inputs with outputs for increasingly progressive pattern identification; the latter approach uses expert, human-crafted rules to apply to particular real-world domains.

Read the full article at SD Times.


What is the most interesting use of a graph database you ever seen? PWC responds.

From a Quora post by Alan Morrison – Sr. Research Fellow at PricewaterhouseCoopers – November 2018

The most interesting use is the most powerful: standard RDF graphs for large-scale knowledge graph integration.

From my notes on a talk Parsa Mirhaji of Montefiore Health System gave in 2017. Montefiore uses Franz AllegroGraph, a distributed RDF graph database. He modeled a core patient-centric hospital knowledge need using a simple standard ontology with a 1,000 or so concepts total.

That model integrated data from lots of different kinds of heterogeneous sources so that doctors could query the knowledge graph from tablets or phones at a patient’s bedside and get contextualized, patient-specific answers to questions for diagnostic purposes.

Fast forward to 2018, and nine out of ten of the most value-creating companies in the world are using standard knowledge graphs in a comparable fashion, either as a base for multi-domain intelligent assistants a la Siri or Alibot or Alexa, or to integrate and contextualize business domains cross-enterprise, or both. The method is preparatory to what John Launchbury of DARPA described as the Third Wave of AI………….

Read the full article over at Quora

.


AI Requires More Than Machine Learning

From Forbes Technology Council – October 2018

This article discusses the facets of machine learning and AI:

Lauded primarily for its automation and decision support, machine learning is undoubtedly a vital component of artificial intelligence. However, a small but growing number of thought leaders throughout the industry are acknowledging that the breadth of AI’s upper cognitive capabilities involves more than just machine learning.

Machine learning is all about sophisticated pattern recognition. It’s virtually unsurpassable at determining relevant, predictive outputs from a series of data-driven inputs. Nevertheless, there is a plethora of everyday, practical business problems that cannot be solved with input/output reasoning alone. The problems also require the multistep, symbolic reasoning of rules-based systems.

Whereas machine learning is rooted in a statistical approach, symbolic reasoning is predicated on the symbolic representation of a problem usually rooted in a knowledge base. Most rules-based systems involve multistep reasoning, including those powered by coding languages such as Prolog.


Read the full article over at Forbes

.


Optimizing Fraud Management with AI Knowledge Graphs

From Global Banking and Finance Review – July 12, 2018

This article discusses Knowledge Graphs for Anti-Money Laundering (AML), Suspicious Activity Reports (SAR), counterfeiting and social engineering falsities, as well as synthetic, first-party, and card-not-present fraud.

By compiling fraud-related data into an AI knowledge graph, risk management personnel can also triage those alerts for the right action at the right time. They also get the additive benefit of reusing this graph to decrease other risks for security, loans, or additional financial purposes.

Dr. Aasman goes on to note:

By incorporating AI, these threat maps yields a plethora of information for actually preventing fraud. Supervised learning methods can readily identify what events constitute fraud and which don’t; many of these involve classic machine learning.  Unsupervised learning capabilities are influential in determining normal user behavior then pinpointing anomalies contributing to fraud. Perhaps the most effective way AI underpins risk management knowledge graphs is in predicting the likelihood—and when—a specific fraud instance will take place. Once organizations have data for customers, events, and fraud types over a length of time (which could be in as little as a month in the rapidly evolving financial crimes space), they can compute the co-occurrence between events and fraud types.

Read the full article over at Global Banking and Finance Review.


The Most Secure Graph Database Available

Triples offer a way of describing model elements and relationships between them. In come cases, however, it is also convenient to be able to store data that is associated with a triple as a whole rather than with a particular element. For instance one might wish to record the source from which a triple has been imported or access level necessary to include it in query results. Traditional solutions of this problem include using graphs, RDF reification or triple IDs. All of these approaches suffer from various flexibility and performance issues. For this reason AllegroGraph offers an alternative: triple attributes.
Attributes are key-value pairs associated with a triple. Keys refer to attribute definitions that must be added to the store before they are used. Values are strings. The set of legal values of an attribute can be constrained by the definition of that attribute. It is possible to associate multiple values of a given attribute with a single triple.
Possible uses for triple attributes include:
  • Access control: It is possible to instruct AllegroGraph to prevent an user from accessing triples with certain attributes.
  • Sharding: Attributes can be used to ensure that related triples are always placed in the same shard when AllegroGraph acts as a distributed triple store.
Like all other triple components, attribute values are immutable. They must be provided when the triple is added to the store and cannot be changed or removed later.
To illustrate the use of triple attributes we will construct an artificial data set containing a log of information about contacts detected by a submarine at a single moment in time.

Managing attribute definitions

Before we can add triples with attributes to the store we must create appropriate attribute definitions.
First let’s open a connection
from franz.openrdf.connect import ag_connect

conn = ag_connect('python-tutorial', create=True, clear=True)
Attribute definitions are represented by AttributeDefinition objects. Each definition has a name, which must be unique, and a few optional properties (that can also be passed as constructor arguments):
  • allowed_values: a list of strings. If this property is set then only the values from this list can be used for the defined attribute.
  • ordered: a boolean. If true then attribute value comparisons will use the ordering defined by allowed_values. The default is false.
  • minimum_numbermaximum_number: integers that can be used to constrain the cardinality of an attribute. By default there are no limits.
Let’s define a few attributes that we will later use to demonstrate various attribute-related capabilities of AllegroGraph. To do this, we will use the setAttributeDefinition() method of the connection object.
from franz.openrdf.repository.attributes import AttributeDefinition

# A simple attribute with no constraints governing the set
# of legal values or the number of values that can be
# associated with a triple.
tag = AttributeDefinition(name='tag')

# An attribute with a limited set of legal values.
# Every bit of data can come from multiple sources.
# We encode this information in triple attributes,
# since it refers to the tripe as a whole. Another
# way of achieving this would be to use triple ids
# or RDF reification.
source = AttributeDefinition(
    name='source',
    allowed_values=['sonar', 'radar', 'esm', 'visual'])

# Security level - notice that the values are ordered
# and each triple *must* have exactly one value for
# this attribute. We will use this to prevent some
# users from accessing classified data.
level = AttributeDefinition(
    name='level',
    allowed_values=['low', 'medium', 'high'],
    ordered=True,
    minimum_number=1,
    maximum_number=1)

# An attribute like this could be used for sharding.
# That would ensure that data related to a particular
# contact is never partitioned across multiple shards.
# Note that this attribute is required, since without
# it an attribute-sharded triple store would not know
# what to do with a triple.
contact = AttributeDefinition(
    name='contact',
    minimum_number=1,
    maximum_number=1)

# So far we have created definition objects, but we
# have not yet sent those definitions to the server.
# Let's do this now.
conn.setAttributeDefinition(tag)
conn.setAttributeDefinition(source)
conn.setAttributeDefinition(level)
conn.setAttributeDefinition(contact)

# This line is not strictly necessary, because our
# connection operates in autocommit mode.
# However, it is important to note that attribute
# definitions have to be committed before they can
# be used by other sessions.
conn.commit()
It is possible to retrieve the list of attribute definitions from a repository by using the getAttributeDefinitions() method:
for attr in conn.getAttributeDefinitions():
    print('Name: {0}'.format(attr.name))
    if attr.allowed_values:
        print('Allowed values: {0}'.format(
            ', '.join(attr.allowed_values)))
        print('Ordered: {0}'.format(
            'Y' if attr.ordered else 'N'))
    print('Min count: {0}'.format(attr.minimum_number))
    print('Max count: {0}'.format(attr.maximum_number))
    print()
Notice that in cases where the maximum cardinality has not been explicitly defined, the server replaced it with a default value. In practice this value is high enough to be interpreted as ‘no limit’.
 Name: tag
 Min count: 0
 Max count: 1152921504606846975

 Name: source
 Allowed values: sonar, radar, esm, visual
 Min count: 0
 Max count: 1152921504606846975
 Ordered: N

 Name: level
 Allowed values: low, medium, high
 Ordered: Y
 Min count: 1
 Max count: 1

 Name: contact
 Min count: 1
 Max count: 1
Attribute definitions can be removed (provided that the attribute is not used by the static attribute filter, which will be discussed later) by calling deleteAttributeDefinition():
conn.deleteAttributeDefinition('tag')
defs = conn.getAttributeDefinitions()
print(', '.join(sorted(a.name for a in defs)))
contact, level, source

Adding triples with attributes

Now that the attribute definitions have been established we can demonstrate the process of adding triples with attributes. This can be achieved using various methods. A common element of all these methods is the way in which triple attributes are represented. In all cases dictionaries with attribute names as keys and strings or lists of strings as values are used.
When addTriple() is used it is possible to pass attributes in a keyword parameter, as shown below:
ex = conn.namespace('ex://')
conn.addTriple(ex.S1, ex.cls, ex.Udaloy, attributes={
    'source': 'sonar',
    'level': 'low',
    'contact': 'S1'
})
The addStatement() method works in similar way. Note that it is not possible to include attributes in the Statement object itself.
from franz.openrdf.model import Statement

s = Statement(ex.M1, ex.cls, ex.Zumwalt)
conn.addStatement(s, attributes={
    'source': ['sonar', 'esm'],
    'level': 'medium',
    'contact': 'M1'
})
When adding multiple triples with addTriples() one can add a fifth element to each tuple to represent attributes. Let us illustrate this by adding an aircraft to our dataset.
conn.addTriples(
    [(ex.R1, ex.cls, ex['Ka-27'], None,
      {'source': 'radar',
       'level': 'low',
       'contact': 'R1'}),
     (ex.R1, ex.altitude, 200, None,
      {'source': 'radar',
       'level': 'medium',
       'contact': 'R1'})])
When all or most of the added triples share the same attribute set it might be convenient to use the attributes keyword parameter. This provides default values, but is completely ignored for all tuples that already contain attributes (the dictionaries are not merged). In the example below we add a triple representing an aircraft carrier and a few more triples that specify its position. Notice that the first triple has a lower security level and multiple sources. The common ‘contact’ attribute could be used to ensure that all this data will remain on a single shard.
conn.addTriples(
    [(ex.M2, ex.cls, ex.Kuznetsov, None, {
        'source': ['sonar', 'radar', 'visual'],
        'contact': 'M2',
        'level': 'low',
     }),
     (ex.M2, ex.position, ex.pos343),
     (ex.pos343, ex.x, 430.0),
     (ex.pos343, ex.y, 240.0)],
    attributes={
       'contact': 'M2',
       'source': 'radar',
       'level': 'medium'
    })
Another method of adding triples with attributes is to use the NQX file format. This works both with addFile() and addData() (illustrated below):
from franz.openrdf.rio.rdfformat import RDFFormat

conn.addData('''
    <ex://S2> <ex://cls> <ex://Alpha> \
    {"source": "sonar", "level": "medium", "contact": "S2"} .
    <ex://S2> <ex://depth> "300" \
    {"source": "sonar", "level": "medium", "contact": "S2"} .
    <ex://S2> <ex://speed_kn> "15.0" \
    {"source": "sonar", "level": "medium", "contact": "S2"} .
''', rdf_format=RDFFormat.NQX)
When importing from a format that does not support attributes, it is possible to provide a common set of attribute values with a keyword parameter:
from franz.openrdf.rio.rdfformat import RDFFormat

conn.addData('''
    <ex://V1> <ex://cls> <ex://Walrus> ;
              <ex://altitude> 100 ;
              <ex://speed_kn> 12.0e+8 .
    <ex://V2> <ex://cls> <ex://Walrus> ;
              <ex://altitude> 200 ;
              <ex://speed_kn> 12.0e+8 .
    <ex://V3> <ex://cls> <ex://Walrus> ;
              <ex://altitude> 300;
              <ex://speed_kn> 12.0e+8 .
    <ex://V4> <ex://cls> <ex://Walrus> ;
              <ex://altitude> 400 ;
              <ex://speed_kn> 12.0e+8 .
    <ex://V5> <ex://cls> <ex://Walrus> ;
              <ex://altitude> 500 ;
              <ex://speed_kn> 12.0e+8 .
    <ex://V6> <ex://cls> <ex://Walrus> ;
              <ex://altitude> 600 ;
              <ex://speed_kn> 12.0e+8 .
''', attributes={
    'source': 'visual',
    'level': 'high',
    'contact': 'a therapist'})
The data above represents six visually observed Walrus-class submarines, flying at different altitudes and well above the speed of light. It has been highly classified to conceal the fact that someone has clearly been drinking while on duty – after all there are only four Walrus-class submarines currently in service, so the observation is obviously incorrect.

Retrieving attribute values

We will now print all the data we have added to the store, including attributes, to verify that everything worked as expected. The only way to do that is through a SPARQL query using the appropriate magic property to access the attributes. The query below binds a literal containing a JSON representation of triple attributes to the ?a variable:
import json

r = conn.executeTupleQuery('''
   PREFIX attr: <http://franz.com/ns/allegrograph/6.2.0/>
   SELECT ?s ?p ?o ?a {
       ?s ?p ?o .
       ?a attr:attributes (?s ?p ?o) .
   } ORDER BY ?s ?p ?o''')
with r:
    for row in r:
        print(row['s'], row['p'], row['o'])
        print(json.dumps(json.loads(row['a'].label),
                         sort_keys=True,
                         indent=4))
The result contains all the expected triples with pretty-printed attributes.
<ex://M1> <ex://cls> <ex://Zumwalt>
{
    "contact": "M1",
    "level": "medium",
    "source": [
        "esm",
        "sonar"
    ]
}
<ex://M2> <ex://cls> <ex://Kuznetsov>
{
    "contact": "M2",
    "level": "low",
    "source": [
        "visual",
        "radar",
        "sonar"
    ]
}
<ex://M2> <ex://position> <ex://pos343>
{
    "contact": "M2",
    "level": "medium",
    "source": "radar"
}
<ex://R1> <ex://altitude> "200"^^...
{
    "contact": "R1",
    "level": "medium",
    "source": "radar"
}
<ex://R1> <ex://cls> <ex://Ka-27>
{
    "contact": "R1",
    "level": "low",
    "source": "radar"
}
<ex://S1> <ex://cls> <ex://Udaloy>
{
    "contact": "S1",
    "level": "low",
    "source": "sonar"
}
<ex://S2> <ex://cls> <ex://Alpha>
{
    "contact": "S2",
    "level": "medium",
    "source": "sonar"
}
<ex://S2> <ex://depth> "300"
{
    "contact": "S2",
    "level": "medium",
    "source": "sonar"
}
<ex://S2> <ex://speed_kn> "15.0"
{
    "contact": "S2",
    "level": "medium",
    "source": "sonar"
}
<ex://V1> <ex://altitude> "100"^^...
{
    "contact": "a therapist",
    "level": "high",
    "source": "visual"
}
<ex://V1> <ex://cls> <ex://Walrus>
{
    "contact": "a therapist",
    "level": "high",
    "source": "visual"
}
<ex://V1> <ex://speed_kn> "1.2E9"^^...
{
    "contact": "a therapist",
    "level": "high",
    "source": "visual"
}
...
<ex://pos343> <ex://x> "4.3E2"^^...
{
    "contact": "M2",
    "level": "medium",
    "source": "radar"
}
<ex://pos343> <ex://y> "2.4E2"^^...
{
    "contact": "M2",
    "level": "medium",
    "source": "radar"
}

Attribute filters

Triple attributes can be used to provide fine-grained access control. This can be achieved by using static attribute filters.
Static attribute filters are simple expressions that control which triples are visible to a query based on triple attributes. Each repository has a single, global attribute filter that can be modified using setAttributeFilter(). The values passed to this method must be either strings (the syntax is described in the documentation of static attribute filters) or filter objects.
Filter objects are created by applying set operators to ‘attribute sets’. These can then be combined using filter operators.
An attribute set can be one of the following:
  • a string or a list of strings: represents a constant set of values.
  • TripleAttribute.name: represents the value of the name attribute associated with the currently inspected triple.
  • UserAttribute.name: represents the value of the name attribute associated with current query. User attributes will be discussed in more detail later.
Available set operators are shown in the table below. All classes and functions mentioned here can be imported from the franz.openrdf.repository.attributes package:
Syntax Meaning
Empty(x) True if the specified attribute set is empty.
Overlap(x, y) True if there is at least one matching value between the two attribute sets.
Subset(x, y)x << y True if every element of x can be found in y
Superset(x, y)x >> y True if every element of y can be found in x
Equal(x, y)x == y True if x and y have exactly the same contents.
Lt(x, y)x < y True if both sets are singletons, at least one of the sets refers to a triple or user attribute, the attribute is ordered and the value of the single element of x occurs before the single value of y in the lowed_values list of the attribute.
Le(x, y)x <= y True if y < x is false.
Eq(x, y) True if both x < y and y < x are false. Note that using the == Python operator translates toEqauls, not Eq.
Ge(x, y)x >= y True if x < y is false.
Gt(x, y)x > y True if y < x.
Note that the overloaded operators only work if at least one of the attribute sets is a UserAttribute or TripleAttribute reference – if both arguments are strings or lists of strings the default Python semantics for each operator are used. The prefix syntax always produces filters.
Filters can be combined using the following operators:
Syntax Meaning
Not(x)~x Negates the meaning of the filter.
And(x, y, ...)x & y True if all subfilters are true.
Or(x, y, ...)x | y True if at least one subfilter is true.
Filter operators also work with raw strings, but overloaded operators will only be recognized if at least one argument is a filter object.

Using filters and user attributes

The example below displays all classes of vessels from the dataset after establishing a static attribute filter which ensures that only sonar contacts are visible:
from franz.openrdf.repository.attributes import *

conn.setAttributeFilter(TripleAttribute.source >> 'sonar')
conn.executeTupleQuery(
    'select ?class { ?s <ex://cls> ?class } order by ?class',
    output=True)
The output contains neither the visually observed Walruses nor the radar detected ASW helicopter.
------------------
| class          |
==================
| ex://Alpha     |
| ex://Kuznetsov |
| ex://Udaloy    |
| ex://Zumwalt   |
------------------
To avoid having to set a static filter before each query (which would be inefficient and cause concurrency issues) we can employ user attributes. User attributes are specific to a particular connection and are sent to the server with each query. The static attribute filter can refer to these and compare them with triple attributes. Thus we can use code presented below to create a filter which ensures that a connection only accesses data at or below the chosen clearance level.
conn.setUserAttributes({'level': 'low'})
conn.setAttributeFilter(
    TripleAttribute.level <= UserAttribute.level)
conn.executeTupleQuery(
    'select ?class { ?s <ex://cls> ?class } order by ?class',
    output=True)
We can see that the output here contains only contacts with the access level of low. It omits the destroyer and Alpha submarine (these require medium level) as well as the top-secret Walruses.
------------------
| class          |
==================
| ex://Ka-27     |
| ex://Kuznetsov |
| ex://Udaloy    |
------------------
The main advantage of the code presented above is that the filter can be set globally during the application setup and access control can then be achieved by varying user attributes on connection objects.
Let us now remove the attribute filter to prevent it from interfering with other examples. We will use the clearAttributeFilter() method.
conn.clearAttributeFilter()
It might be useful to change connection’s attributes temporarily for the duration of a single code block and restore prior attributes after that. This can be achieved using the temporaryUserAttributes() method, which returns a context manager. The example below illustrates its use. It also shows how to use getUserAttributes() to inspect user attributes.
with conn.temporaryUserAttributes({'level': 'high'}):
    print('User attributes inside the block:')
    for k, v in conn.getUserAttributes().items():
        print('{0}: {1}'.format(k, v))
    print()
print('User attributes outside the block:')
for k, v in conn.getUserAttributes().items():
    print('{0}: {1}'.format(k, v))
User attributes inside the block:
level: high

User attributes outside the block:
level: low »


Making Big Data More Meaningful through Data Visualization

We’ve all heard the saying, “a picture says a thousand words.” With today’s millisecond attention spans, communicating a complex topic to any audience – business professional, consumer, doctor, investor, policy-maker, voter — has become more challenging than ever. Some industries are now taking this seriously and investing in new data visualization techniques.

Data visualization is a fundamental part of scientific research. In a scientific journal, pictures certainly do seem to be worth a thousand words, with graphs translating large amounts of data into insightful, visual representations.

Read the full article at insideBIGDATA


AllegroGraph News

Franz periodically distributes newsletters to its Knowledge Graph, Semantic Technologies, and Common Lisp based Enterprise Development Tools mailing lists, providing information on related upcoming events and new software product developments.

Some Topics from September:

  1. Franz and Semantic Web Company Partner to Create a Noam Chomsky Knowledge Graph
  2. Graph Day – San Francisco – September 15
  3. InfoWorld – How enterprise knowledge graphs can proactively reduce risk
  4. Franz Inc. named to the DBTA 100 – The Companies That Matter Most in Data
  5. Gartner – Knowledge Graphs Emerge in the HypeCycle
  6. IEEE Publication – Transmuting Information to Knowledge with an Enterprise Knowledge Graph
  7. International Semantic Web Conference – ISWC 2018 – Franz Inc. is a Platinum Sponsor
  8. Optimizing Fraud Management with AI Knowledge Graphs
  9. The Cornerstone of Data Science: Progressive Data Modeling
  10. How AI Boosts Human Expertise at Wolters Kluwer

Read our latest AllegroGraph newsletter.

Previous issues are listed in the Newsletter Archive.


Franz Inc. and The Wroclaw Institute of Spatial Information and Artificial Intelligence (The Wroclaw Institute) team up to deliver graph and A.I. solutions in Poland

A Wroclaw Institute News Release

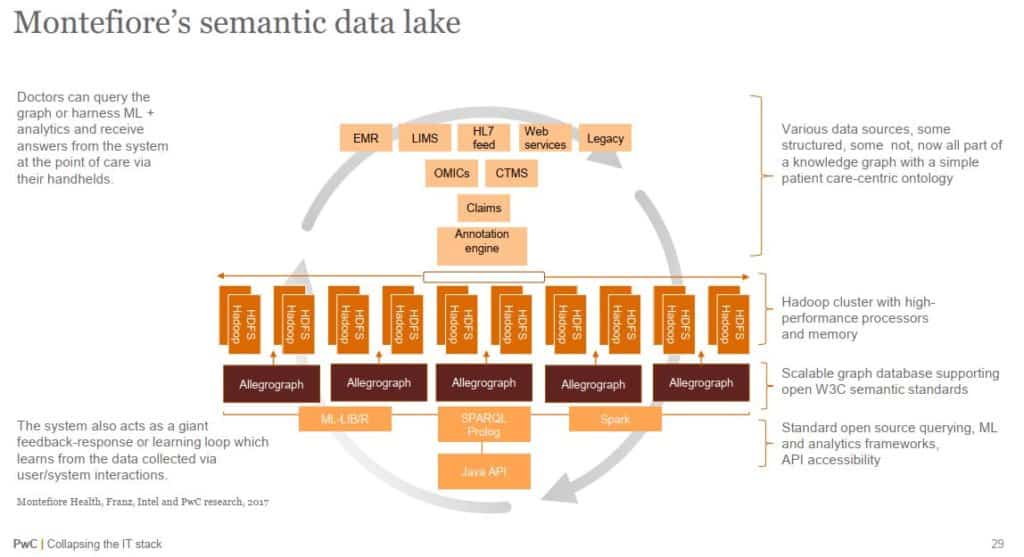
OAKLAND, Calif. — March 15, 2016 — We are pleased to inform that Wroclaw Institute has been appointed as a partner by Franz Inc.– world’s leading producer of semantic graph technologies. The agreement grants to Wroclaw Institute exclusive right to sell Franz’s – AllegroGraph family of products for territory of Poland. AllegroGraph is best in class graph database, fully supporting W3C standards adopted by start-up’s as well as vast number of Fortune 100 companies. AllegroGraph is a part of Big Data ecosystem as it could be integrated with Apache Hadoop and Amazon EC2.

The Wroclaw Institute CEO – Dr. Adam Iwaniak said “Partnership with Franz Inc. is a turning point for our company as semantic graph technology is gaining a lot of market attention in ‘data tsunami’ era. We are happy that we will be able to provide our customers with award winning solution to help them manage their complex data resources. Moreover I’d like to emphasize that as a company we made a big progress in leveraging RDF graphs technologies also on our basic market – geoinformatics”.

“We are excited about the opportunity to work with Dr. Iwaniak and the Wroclaw Institute team to demonstrate why Graph Databases deliver new, real time decision making capabilities for the Enterprise.” said Dr. Jans Aasman, CEO, Franz Inc., “Organizations across Poland will benefit from AllegroGraph’s ability to link highly complex data, generating new knowledge and insight for a significant competitive advantage.”

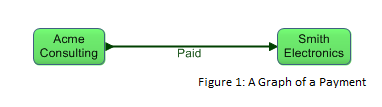
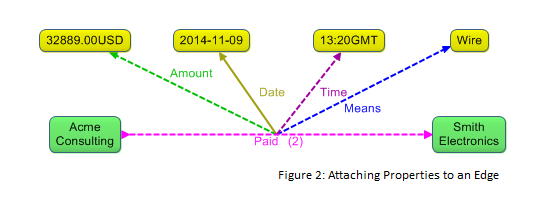
AllegroGraph is a database technology that enables businesses to extract sophisticated decision insights and predictive analytics from their highly complex, distributed data that can’t be answered with conventional databases. Unlike traditional relational databases, Franz’s product AllegroGraph employs a combination of semantic, graph and spatial technologies that process data with contextual and conceptual intelligence. AllegroGraph is able to run queries of unprecedented complexity to support predictive analytics that help companies make better, real-time decisions.

AllegroGraph is commonly used in defense and intelligence, banking, and insurance, pharmaceutical, and healthcare, Linked Data publishing, as well as by organization dealing with complex, constantly changing knowledge bases.

About Franz Inc.

Franz Inc. is a leading vendor of semantic technology tools featuring AllegroGraph – high-performance, scalable, disk-based graph database, provides the solid storage layer for powerful GeoTemporal Reasoning, Social Network Analytics and Ontology Modeling. Based in Oakland, California, Franz Inc. is an American owned company that delivers leading-edge development products that enable software developers to build flexible, scalable, semantic applications quickly and cost-effectively.

About The Wroclaw Institute

The Wroclaw Institute of Spatial Information and Artificial Intelligence is Wroclaw, Poland based technology company focused on knowledge engineering, data exploration and intelligent GIS providing products, services and solutions based on cutting-edge scientific and technological achievements.

Related Links


All trademarks and registered trademarks in this document are the properties of their respective owners.


Enriching Property Graphs with Relationship

Suppose we are creating a large graph database that contains information about payments between companies. A graph database analyst might start off modeling the payments as shown in Figure 1, which expresses who paid whom. (All graph figures in this article were produced using Gruff, a tool for visualizing graph databases, operating over the AllegroGraph graph database system.)

Payment Graph

This seems straightforward enough. Now suppose that we want to record more information about payments, such as the amount of the payment, the means of payment (direct debit, e-check, wire, etc.), the date and time when the payment occurred, and so forth. A traditional property graph approach places these properties on the edge that connects the payor and payee nodes, as shown in Figure 2.

properties to edge

Read the full blog post at DB-Engines