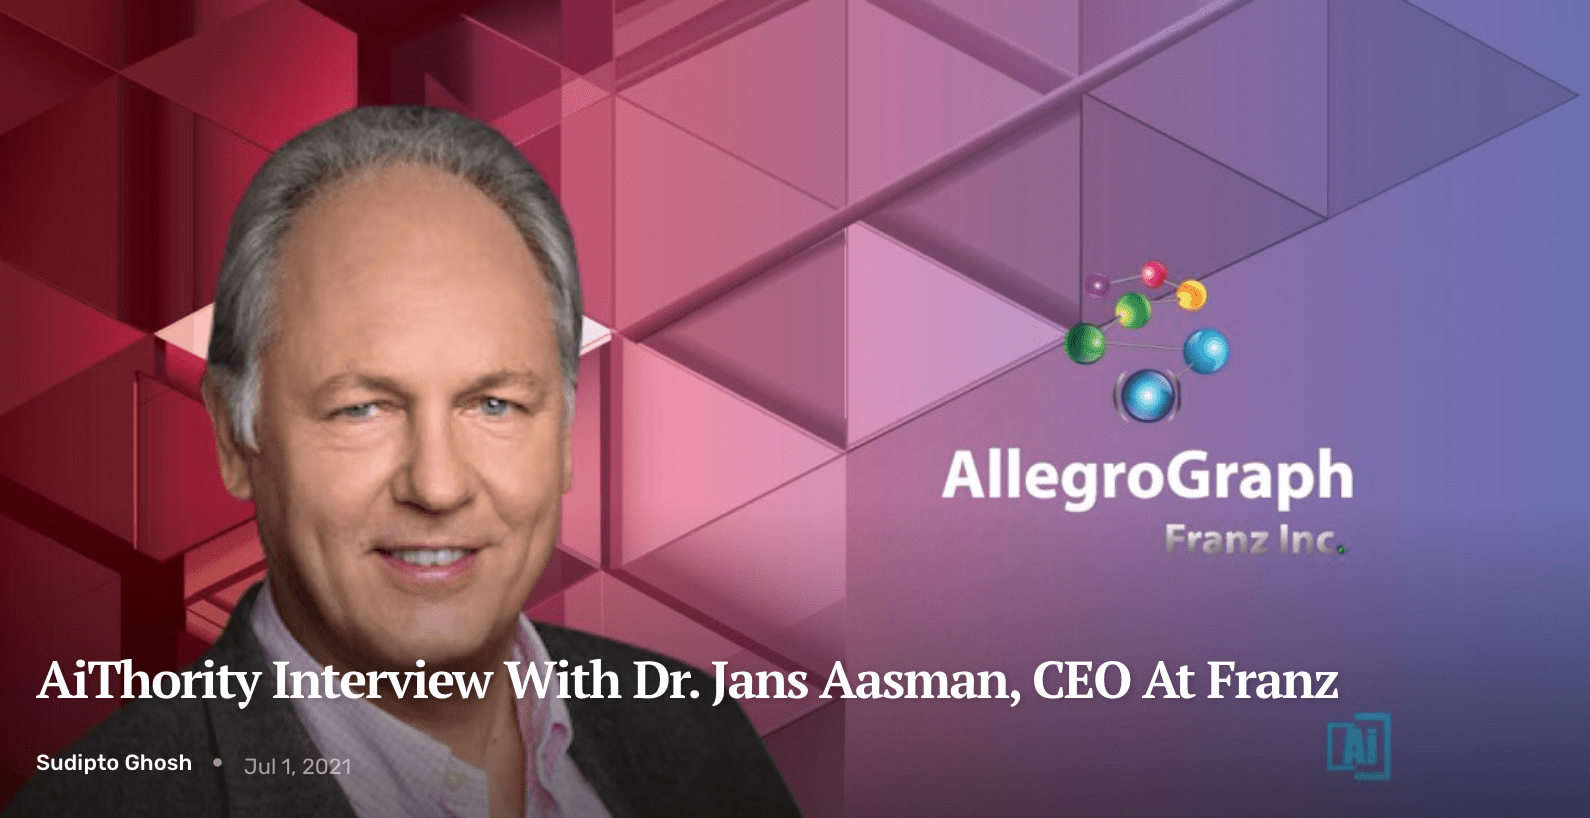
AiThority Interview with Dr. Jans Aasman

Jans Aasman, please tell us about your current role and the team / technology you handle at Franz.

As CEO of Franz Inc., I drive the overall technology vision for our Enterprise Knowledge Graph solutions and ensure our customer projects deliver the ROI results expected with graph based architectures.

Franz Inc. is composed of an expert team with skills in Graph Databases, Semantic technologies, Graph Visualization, AI, NLP and Machine Learning.  Our domain knowledge encompasses large enterprises in Healthcare, Pharma, Customer Support, and Intelligence Agencies.

Our main business today revolves around AllegroGraph, a Semantic Graph platform that allows infinite data integration through a patented approach unifying all data and siloed knowledge into an Entity-Event Knowledge Graph solution that can support massive big data analytics. AllegroGraph’s FedShard feature utilizes patented federated sharding capabilities that drive 360-degree insights and enable complex reasoning across a distributed Knowledge Graph. AllegroGraph is utilized by dozens of the top Fortune 500 companies worldwide.

We also offer a popular data visualization and no-code query builder called Gruff – the most advanced Knowledge Graph visualization application on the market, which we recently integrated into Franz AllegroGraph. Gruff enables users to create visual Knowledge Graphs that display data relationships in views that are driven by the user. Ad hoc and exploratory analysis can be performed by simply clicking on different graph nodes to answer questions. Gruff’s unique ‘Time Machine’ feature provides the capability to explore temporal context and connections within data. The visual query builder within Gruff empowers both novice and expert users to create simple to highly complex queries without writing any code.

Read the full interview at AIThority.


Comex AI Conference 2021 (Recording)

COMEX is the largest Technology, Communications, Innovation and Digital Transformation show in the Sultanate of Oman and offers exhibitors and visitors a comprehensive and highly specialized platform for industry leading discussions, knowledge-sharing, B2B meetings.

Dr. Sheng-Chuan Wu presented – Using AI for Practical Business Applications


Gartner Case Study: Entity-Event Knowledge Graph for Powering AI Solutions (Montefiore)

Gartner featured Franz’s customer, Montefiore Medical Center, in a research report on Montefiore’s Entity-Event Knowledge Graph:

“AI solutions are often hindered by fragmented data and siloed point solutions,” according to Gartner’s Chief Data and Analytics Officer Research Team. “Montefiore’s data and analytics leader used semantic knowledge graphs to power its AI solutions and achieved considerable cost savings as well as improvements in timeliness and the prediction accuracy of AI models.” Source: Gartner Case Study: Entity-Event Knowledge Graph for Powering AI Solutions (Montefiore) – Subscription required.

Copy Available from Montefiore/Einstein.


KMWorld 100 Companies that Matter Most – Franz Inc.

Franz Inc., is proud to announce that it has been named to The 100 Companies That Matter in Knowledge Management by KMWorld. The annual list reflects the urgency felt among many organizations to provide a timely flow of targeted information. Among the more prominent initiatives is the use of AI and cognitive computing, as well as related capabilities such as machine learning, natural language processing, and text analytics.

“Flexibility, agility, and the ability to pivot are attributes that have become critical to forward-thinking companies—and that is particularly the case now. Successful organizations don’t want to merely survive; they want to dominate their market sectors. But to do that, they need the right tools and products,” said Tom Hogan, Group Publisher at KMWorld. “Amidst the dramatic changes taking place today, innovative organizations are seeking new approaches to improve their processes. The 2021 KMWorld 100 is a list of leading-edge knowledge management companies that are helping their customers to expand access to information, leverage new opportunities, and accelerate growth.”

Read More about Franz Inc.


Data-Centric Architecture Forum – DCAF 2021

Data and the subsequent knowledge derived from information are the most valuable strategic asset an organization possesses. Despite the abundance of sophisticated technology developments, most organizations don’t have disciplines or a plan to enable data-centric principles.

DCAF 2021 will help provide clarity.

Our overarching theme for this conference is to make it REAL. Real in the sense that others are becoming data-centric, it is achievable, and you are not alone in your efforts.

Join us in understanding how data as an open, centralized resource outlives any application. Once globally integrated by sharing a common meaning, internal and external data can be readily integrated, unlike the traditional “application-centric” mindset predominantly used in systems development.

The compounding problem is these application systems each have their own completely idiosyncratic data models. The net result is that after a few decades, hundreds or thousands of applications implemented have given origin to a segregated family of disparate data silos. Integration debt rises and unsustainable architectural complexity abounds with every application bought, developed, or rented (SaaS).

Becoming data-centric will improve data characteristics of findability, accessibility, interoperability, and re-usability (FAIR principles), thereby allowing data to be exported into any needed format with virtually free integration.\

Dr. Jans Aasman to present – Franz’s approach to Entity Event Data Modeling for Enterprise Knowledge Fabrics


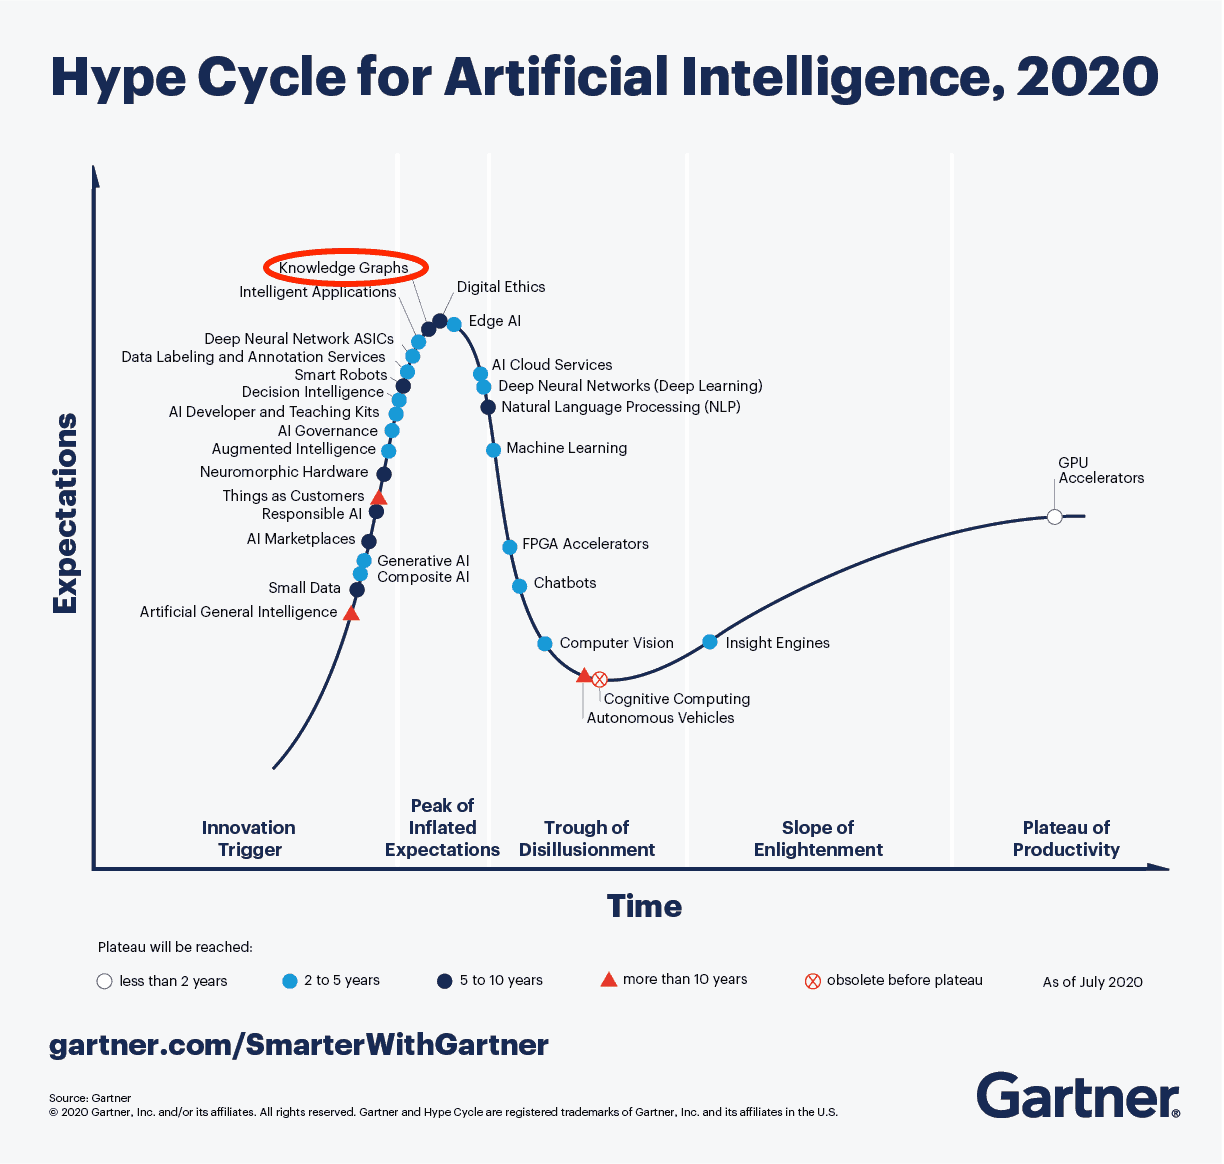
Gartner Hype Cycle for AI – Knowledge Graphs

According to Gartner’s 2020 Hype Cycle for Artificial Intelligence – Despite the global impact of COVID-19, 47% of artificial intelligence (AI) investments were unchanged since the start of the pandemic and 30% of organizations actually planned to increase such investments, according to a Gartner poll. Only 16% had temporarily suspended AI investments, and just 7% had decreased them.

“AI is starting to deliver on its potential and its benefits for businesses are becoming a reality”

Gartner’s – AI Hype Cycle Article 

The Hype Cycle growth is consistent with Franz’s customer interest in our Enterprise Knowledge Graph Solutions – Read our recent White Paper.


Connected Data London – The Future of AI in the Enterprise

The Future of AI in the Enterprise:

Entity-Event Knowledge Graphs for Data-Centric Organizations

Presented by:  Dr. Jans Aasman

Register: https://enterprise-kg-cdl-online-meetup.heysummit.com/

Personalized medicine. Predictive call centers. Digital twins for IoT. Predictive supply chain management, and domain-specific Q&A applications. These are just a few AI-driven applications organizations across a broad range of industries are deploying.

Graph databases and Knowledge Graphs are now viewed as a must-have by Enterprises serious about leveraging AI and predictive analytics within their organization.

See how Franz Inc. is helping organizations deploy novel Entity-Event Knowledge Graph Solutions to gain a holistic view of customers, patients, students or other important entities, and the ability to discover deep connections, uncover new patterns and attain explainable results.

Description:

To support ubiquitous AI, a Knowledge Graph system will have to fuse and integrate data, not just in representation, but in context (ontologies, metadata, domain knowledge, terminology systems), and time (temporal relationships between components of data). Building from ‘Entities’ (e.g. Customers, Patients, Bill of Materials) requires a new data model approach that unifies typical enterprise data with knowledge bases such as industry terms and other domain knowledge.

Entity-Event Knowledge Graphs are about connecting the many dots, from different contexts and throughout time, to support and recommend industry-specific solutions that can take into account all the subtle differences and nuisances of entities and their relevant interactions to deliver insights and drive growth. The Entity-Event Data Model we present puts core entities of interest at the center and then collects several layers of knowledge related to the entity as ‘Events’.

Franz Inc. is working with organizations across a broad range of industries to deploy large-scale, high-performance Entity-Event Knowledge Graphs that serve as the foundation for AI-driven applications for personalized medicine, predictive call centers, digital twins for IoT, predictive supply chain management and domain-specific Q&A applications—just to name a few.

During this presentation we will explain and demonstrate how Entity-Event Knowledge Graphs are the future of AI in the Enterprise.


Using Microsoft Power BI with AllegroGraph

There are multiple methods to integrate AllegroGraph SPARQL results into Microsoft Power BI. In this document we describe two best practices to automate queries and refresh results if you have a production AllegroGraph database with new streaming data:

The first method uses Python scripts to feed Power BI. The second method issues SPARQL queries directly from Power BI using POST requests.

Method 1: Python Script:

Assuming you know Python and have it installed locally, this is definitely the easiest way to incorporate SPARQL results into Power BI. The basic idea of the method is as follows: First, the Python script enables a connection to your desired AllegroGraph repository. Then we utilize  AllegroGraph’s Python API within our script to run a SPARQL query and return it as a Pandas dataframe. When running this script within Power BI Desktop, the Python scripting service recognizes all unique dataframes created, and allows you to import the dataframe into Power BI as a table, which can then be used to create visualizations.

Requirements:

  1. You must have the AllegroGraph Python API installed. If you do not, installation instructions are here: https://franz.com/agraph/support/documentation/current/python/install.html
  2. Python scripting must be enabled in Power BI Desktop. Instructions to do so are here: https://docs.microsoft.com/en-us/power-bi/connect-data/desktop-python-scripts

a) As mentioned in the article, pandas and matplotlib must be installed. This can be done with ‘pip install pandas’ and ‘pip install matplotlib’ in your terminal.

The Process:

Once these requirements have been met, create a Python file with whatever script editor you usually use. The following code will create a connection to your desired repository. For this example, we will be using the Kennedy dataset that is available with the AllegroGraph distribution (See the ‘Tutorial’ directory).  Load the Kennedy.ntriples file into your running AllegroGraph. (Replace the ‘****’ in the code with your corresponding username and password.)

#the necessary imports

import os

from franz.openrdf.connect import ag_connect

from franz.openrdf.query.query import QueryLanguage

import pandas as pd


#connect to your agraph repository

def setup_env_var(var_name, value, description):

os.environ[var_name] = value

print("{}: {}".format(description, value))

setup_env_var('AGRAPH_HOST', 'localhost', 'Hostname')

setup_env_var('AGRAPH_PORT', '10035', 'Port')

setup_env_var('AGRAPH_USER', '****', 'Username')

setup_env_var('AGRAPH_PASSWORD', '****', 'Password')

conn = ag_connect('kennedy', create=False, clear=False)


2. We then want to create a query. For this example, we will first show what our data looks like, what the visual query of the information is, and what the written query looks like. With the following query we want every person’s first and last names, as well as their birth years. Here is a small portion of the data visualized in Gruff, and then the visualization of the query:


3. Then add the written query to the python script as a variable string (we added an additional line to the query to sort on birth year). Next use the API functionality to simply execute the query and turn the results into a pandas dataframe.

query = """select ?person ?first_name ?last_name ?birth_year where
{ ?person <http://www.franz.com/simple#first-name> ?first_name ;
          <http://www.franz.com/simple#birth-year> ?birth_year ;
          rdf:type <http://www.franz.com/simple#person> ;
          <http://www.franz.com/simple#last-name> ?last_name . }
order by desc(?birth_year)"""

with conn.executeTupleQuery(query) as result:
   df = result.toPandas()


When looking at the result, we see that we have a DataFrame!

4.  Now we will use this script in Power BI. When in Power BI Desktop, go to ‘Get Data’ and look for the python script option. Then simply copy and paste your entire script into the text box, and run the script. In this case, our output looks like this:

5.  Next simply ‘Load’ the data, and then you can use the Power BI Desktop interface to create whatever visualizations you want! If you do have a lot of additional operations to perform on your dataframe, we recommend doing these in your python script.


Method 2: POST Request:

For the SPARQL query via POST requests to work you need to url-encode the query. Every modern programming language will support that, but in our example we will be using Python again. This method is better for when you do not have python locally installed or prefer a different programming language.

It is possible to send a GET request from Power BI, but once the results from the query reach a certain size, a POST request is required, which is confusing to do within the Power BI Desktop interface. The following steps will show you how to do SPARQL Queries using POST requests. It looks a bit odd but it works well.

The Process:

1.  In your AG WebView create an ‘anonymous’ user. (Go to admin -> Users -> [add a user] -> and add ‘anonymous’ as username without adding a password). You can use these settings:

2.  Go to your desired repository in WebView and Click on ‘Queries’ -> ‘New’

3.  Write a simple SPARQL query, and run it to make sure you get the correct response back.

4.  In python create the following script: (Assuming your AllegroGraph is on your localhost port 10035 and your repo is called ‘kennedy’)


import urllib

def CreatePOSTquery(query):
    start = "http://anonymous:@localhost:10035/repositories/kennedy?queryLn=SPARQL&limit=1000&infer=false&returnQueryMetadata=false&checkVariables=false&query="
    response = start + urllib.parse.quote(query)
    return response


This function url-encodes the query and attaches it to the POST request. Replace the ‘localhost:10035’ and ‘kennedy’ strings in the start variable with your corresponding data. Then, using the same query as our previous example, we create our url-encoded POST query:


query = """select ?person ?first_name ?last_name ?birth_year where
{ ?person <http://www.franz.com/simple#first-name> ?first_name ;
          <http://www.franz.com/simple#birth-year> ?birth_year ;
          rdf:type <http://www.franz.com/simple#person> ;
          <http://www.franz.com/simple#last-name> ?last_name . }
order by desc(?birth_year)"""

result = CreatePOSTquery(query)
print(result)


This gives us the following result:


5.  Within Power BI Desktop we go to ‘Get data’ and create a ‘Blank query’ and go into the ‘Advanced Editor’ window. Using the following format we will get our desired results (please note that due to the length of the url-encoded request, it did not all fit in the image. Copy and pasting into the url field works fine. The ‘url’ variable needs to be in quotes and have a comma at the end):


We see the following results:

6.  One last step is to turn the top row into the column names, which can be achieved by pressing the ‘Use first row as headers’:

The best part about both of these methods is that once the query has been created, Power BI can refresh the visuals using the same queries if your data changed. This can be achieved by scheduling refreshes within the Power BI Desktop interface (https://docs.microsoft.com/en-us/power-bi/connect-data/refresh-data#configure-scheduled-refresh)

Please send any questions or issues to:  [email protected]


Knowledge graphs enhance customer experience through speed and accuracy

KMWorld’s recent article covers AllegroGraph and Franz’s customer N3 Solutions.

The Full Article – KMWorld

Knowledge graphs are a way to model enterprise knowledge and represent complex interrelationships in data. Information stored in a graph database can enable rapid retrieval of well-targeted results and provide insights into customers’ interests and needs. Gartner predicts a 100% per-year growth in applications for graph analytics and databases for the next several years. Although knowledge graphs have been deployed by major companies such as Google, Amazon, and LinkedIn due to their ability to incorporate relationships in their analyses as well as their speed, only in the last 5 years has their use become more widespread.

N3 is an outsourced sales company for major organizations that sell complex B2B software, hardware, and tech solutions. It supports businesses in 92 countries, provides services in 25 languages, and holds thousands of hours of conversations every month with customers and prospects. “In today’s world of complex products, it takes a well-educated team to tell the story about how this technology can help a company become more competitive,” said Shannon Copeland, COO of N3. “The sales team needs to be able to instantly access the information they need to do their job.”

Faster insights

The company has been operating for 16 years, and in the last few years began an initiative to manage its knowledge in a more intentional way. “We generate a great deal of data,” noted Copeland, “and we wanted to make more effective use of it to understand our customers. And because of the speed at which business is transacted now, we needed to get insights right away, not a month later in a report.”

N3 built a data model to reflect the essential data elements and the associations among them and decided that a knowledge graph was the best way to represent the information. After looking into partner options, N3 chose to work with Franz, Inc., which provides a semantic graph database called AllegroGraph. “We decided to work with Franz because of its extensive experience and the fact that it had worked with a variety of industries,” Copeland said.

The system built by N3 allows sales teams to organize signals from the market in a way that allows them to better explain the products to prospective buyers. “We build relationships with tech buyers on behalf of our clients,” continued Copeland. “Our employees are typically college graduates who would like to begin their careers in sales and marketing in tech solutions. They take ownership of their territory and we help them be as sophisticated as a future CMO would be.” The resources supplied by the knowledge graph provide the support the sales team needs to tailor information to each prospective customer.

The specific expertise required by the team varies depending on the products being sold, the geographic region, and other factors, and the knowledge graph supports these needs. For example, if a team in southern Portugal needs to know the preferences of that market, the associations built into the graph database can provide the information that is essential for them. “The information we can access helps customers understand the answers to their questions very quickly,” Copeland commented. “We believe the experience that the customers have helps them scope out what they need and what the road map might be.”

The strength of graph databases

A graph databases is a type of NoSQL database that stores data according to associations among data elements rather than in the rows and columns of a relational database. Because graph databases use a dynamic schema rather than a fixed, table-based one, adding new data types and categories is much easier. And because they are semantics-based, graph databases have strengths in inferring intent, producing answers to questions, and making recommendations. They can also make inferences about possible associations from existing associations.

A graph database also provides much more context than a relational database and therefore can return more relevant results when a user is searching; they also integrate data from multiple sources. “At one telecom company we worked with, customer service reps might have [had] to open 15 databases to find out what went wrong and what the solution was,” said Jans Aasman, CEO of Franz. “We took their core customer data, billing information, every CRM call, and every action and put them into AllegroGraph, and the customer service reps were finally able to respond in a meaningful way, whether that was to make an offer to the customer or provide appropriate technical support.” The capability of graph databases to overcome silos and provide an integrated view of the customer is one of its strengths.

In order to create the graph database on which the knowledge graph is built, the relationships among entities need to be mapped. In the case of a hospital patient, the patient is the core entity, and the events are medical encounters or lab results, which may come out of different databases or a data warehouse. “The mapping is a major project, but it only needs to be done once,” Aasman pointed out. “After that, the relationships do not need to be regenerated during the search because they are indexed in AllegroGraph, which makes retrieval very rapid.”


AllegroGraph Named to 100 Companies That Matter Most in Data

Franz Inc. Acknowledged as a Leader for Knowledge Graph Solutions

Lafayette, Calif., June 23, 2020 — Franz Inc., an early innovator in Artificial Intelligence (AI) and leading supplier of Semantic Graph Database technology for Knowledge Graph Solutions, today announced that it has been named to The 100 Companies That Matter in Data by Database Trends and Applications.  The annual list reflects the urgency felt among many organizations to provide a timely flow of targeted information. Among the more prominent initiatives is the use of AI and cognitive computing, as well as related capabilities such as machine learning, natural language processing, and text analytics.   This list recognizes companies based on their presence, execution, vision and innovation in delivering products and services to the marketplace.

“We’re excited to announce our eighth annual list, as the industry continues to grow and evolve,” remarked Thomas Hogan, Group Publisher at Database Trends and Applications. “Now, more than ever, businesses are looking for ways transform how they operate and deliver value to customers with greater agility, efficiency and innovation. This list seeks to highlight those companies that have been successful in establishing themselves as unique resources for data professionals and stakeholders.”

“We are honored to receive this acknowledgement for our efforts in delivering Enterprise Knowledge Graph Solutions,” said Dr. Jans Aasman, CEO, Franz Inc. “In the past year, we have seen demand for Enterprise Knowledge Graphs take off across industries along with recognition from top technology analyst firms that Knowledge Graphs provide the critical foundation for artificial intelligence applications and predictive analytics.

Our recent launch of AllegroGraph 7 with FedShard, a breakthrough that allows infinite data integration to unify all data and siloed knowledge into an Entity-Event Knowledge Graph solution will catalyze Knowledge Graph deployments across the Enterprise.”

Gartner recently released a report “How to Build Knowledge Graphs That Enable AI-Driven Enterprise Applications” and have previously stated, “The application of graph processing and graph databases will grow at 100 percent annually through 2022 to continuously accelerate data preparation and enable more complex and adaptive data science.” To that end, Gartner named graph analytics as a “Top 10 Data and Analytics Trend” to solve critical business priorities. (Source: Gartner, Top 10 Data and Analytics Trends, November 5, 2019).

“Graph databases and knowledge graphs are now viewed as a must-have by enterprises serious about leveraging AI and predictive analytics within their organization,” said Dr. Aasman “We are working with organizations across a broad range of industries to deploy large-scale, high-performance Entity-Event Knowledge Graphs that serve as the foundation for AI-driven applications for personalized medicine, predictive call centers, digital twins for IoT, predictive supply chain management and domain-specific Q&A applications – just to name a few.”

Forrester Shortlists AllegroGraph

AllegroGraph was shortlisted in the February 3, 2020 Forrester Now Tech: Graph Data Platforms, Q1 2020 report, which recommends that organizations “Use graph data platforms to accelerate connected-data initiatives.” Forrester states, “You can use graph data platforms to become significantly more productive, deliver accurate customer recommendations, and quickly make connections to related data.”

Bloor Research covers AllegroGraph with FedShard

Bloor Research Analyst, Daniel Howard noted “With the 7.0 release of AllegroGraph, arguably the most compelling new capability is its ability to create what Franz refers to as “Entity-Event Knowledge Graphs” (or EEKGs) via its patented FedShard technology.” Mr. Howard goes on to state “Franz clearly considers this a major release for AllegroGraph. Certainly, the introduction of an explicit entity-event graph is not something I’ve seen before. The newly introduced text to speech capabilities also seem highly promising.”

AllegroGraph Named to KMWorld’s 100 Companies That Matter in Knowledge Management

AllegroGraph was also recently named to KMWorld’s 100 Companies That Matter in Knowledge Management.  The KMWorld 100 showcases organizations that are advancing their products and capabilities to meet changing requirements in Knowledge Management.

Franz Knowledge Graph Technology and Services

Franz’s Knowledge Graph Solution includes both technology and services for building industrial strength Entity-Event Knowledge Graphs based on best-of-class tools, products, knowledge, skills and experience. At the core of the solution is Franz’s graph database technology, AllegroGraph with FedShard, which is utilized by dozens of the top F500 companies worldwide and enables businesses to extract sophisticated decision insights and predictive analytics from highly complex, distributed data that cannot be uncovered with conventional databases.

Franz delivers the expertise for designing ontology and taxonomy-based solutions by utilizing standards-based development processes and tools. Franz also offers data integration services from siloed data using W3C industry standard semantics, which can then be continually integrated with information that comes from other data sources. In addition, the Franz data science team provides expertise in custom algorithms to maximize data analytics and uncover hidden knowledge.